Introduction
Our project measures and analyzes the electromechanical properties of tissue using a probe containing a microarray of electrodes, to aid as a tool in predicting the health of the tissue sample.
“Despite significant efforts to develop early detection strategies for breast cancer, the diagnostic efficiency remains poor. Approximately 1 million breast biopsies are performed annually as directed by mass screenings, but 70-80% of these are negative for cancer at an expense of $2.6 Billion. The locally destructive nature of these biopsies incurs a 60% risk of serious morbidity including lymphedema and nerve damage. The spectrum of new devices and methods that have or will reach the market are marginal improvements to the same basic approaches. Our objective is to create a device to diagnose tissue health nondestructively with sensitivity comparable to excisional biopsies.” – Dr. Jonathan Butcher, research advisor.
The foundation of our device is a complex impedance analyzer that is tailored to operate in the desired region of normal tissue impedance.
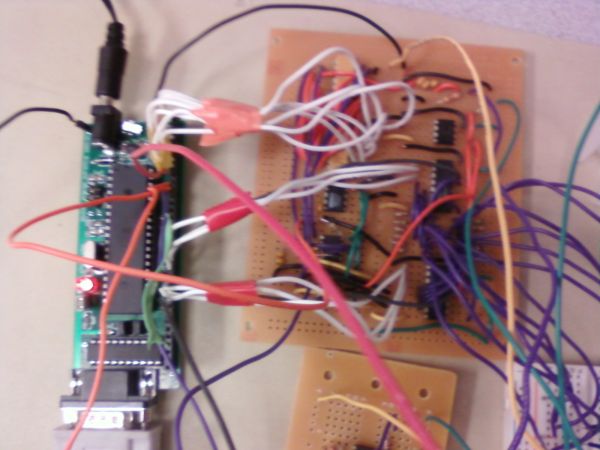
The hardware of our project is responsible for producing signals that accurately reflect the resistance between electrodes and the phase shift caused by capacitive elements of the tissue. Our Atmega644 generates varying sinusoidal voltage waves that are stimulated through the tissue, and converts the analog signals from our circuitry into digital representations of the acquired data. The data is serially sent to a remote PC, and is utilized by Matlab for analysis.
High Level Design
Our project was inspired by current research of one of the team members, Grant, in the Biomedical Engineering Department at Cornell. He is investigating how mechanical stresses to tissue can provide information on the tissue’s health. Electrical tomography devices currently exist in the medical community, however, they focus just on analyzing electrical signals through the body to spot abnormalities. No major projects currently utilize a system that manipulates both electrical and mechanical properties of tissue at once in attempts to characterize its health, and thus a potentially attractive, yet nondestructive device lends itself to our ECE 476 project. Grant’s previous work in the research group had been to develop a simple two-electrode probe that could apply a suction pressure to tissue, and monitor the electrical resistance between the electrodes in hopes to find a correlation between elongation and resistance. Currently, a more sophisticated probe was developed with a microarray of 6 pairs of electrodes, and a more elaborate method of testing could now be used.
First, the electrode array provides increased sensitivity for measurements, because it can collect impedance data from 6 distinct points along the tissue sample. Also, it provides a way to measure the elongation into the pipette non-optically, and can generate a stress-strain curve for the tissue sample. A set of known distances within the pipette can be established since the electrodes are spaced equally throughout the array at 250um apart, with a width of 250um. When tissue first crosses an electrode pair, the resistance between the two nodes drops from an extremely high value (since it is equivalent to an open circuit), to a real valued resistance. This initial drop in resistance can be equated to the tissue just reaching the electrode, and therefore correlated to the distance the electrode is into the pipette. By monitoring the pressure before each impedance reading, we can quickly establish a stress-strain point from this information. Further, when tissue completely covers an electrode, the resistance saturates to a fairly constant value, allowing us to establish another pressure vs. length data point. We can then generate a stress-strain curve with 12 data points; while the resolution and accuracy of this method could be increased with more electrodes for future models, our current electrode array provides enough data for initial research and testing.
Impedance is a complex number that represents the resistance as its real part and reactance as its imaginary part. The phase angle of impedance gives the phase difference between the voltage and current in the system. Resistors have entirely real impedances, and capacitors are entirely imaginary. By measuring the voltage across an unknown load for a given current, we are able to calculate the magnitude of the impedance using the formula Z = V / I. Then, if we know the phase angle, we can find the resistance and reactance of the load.
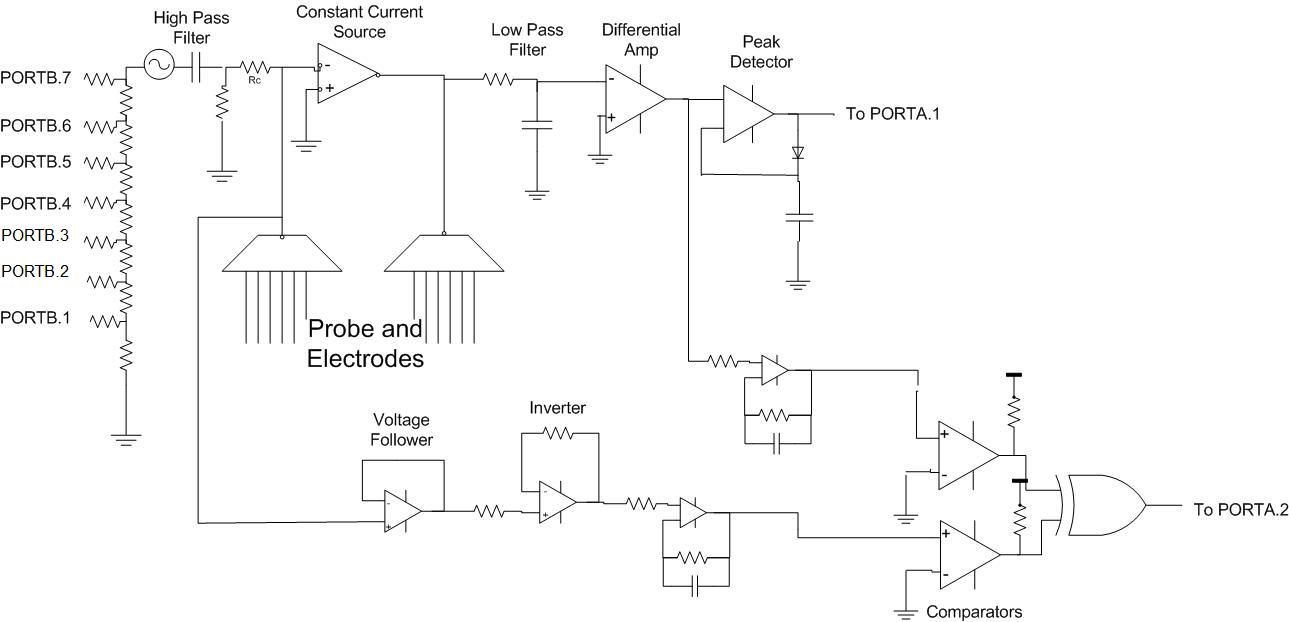
This is the basis of our impedance circuitry. A constant current source generates a consistent current, which is driven across a load, in our case a tissue between a given set of electrodes. By building circuitry that captures the resulting voltage drop between the pair of electrodes, we have the necessary data to form the relationship between current, voltage and impedance. Our circuitry also utilizes a phase comparator that detects the resulting shift between the input sine wave, and the sine wave that results from stimulation across the tissue.
We used a hardware resistor ladder combined with a sinusoidally varying 8 bit variable to generate our sine wave. We started by creating a sine look up table with 256 values spaced evenly throughout the period of a sine wave. We would assign one of these values to the output based on a memory look up. The index of the memory input was an 8-bit char that was actually the highest 8 bits of a 32 bit phase accumulator. The accumulator is updated at 125 kHz by adding a predetermined increment to it. The increment is determined by what frequency output is desired. A small increment may cause the 8 most significant bits to remain unchanged for many accumulator updates. One of the early trade offs we were forced to make was how fast to have these updates occur. Higher frequency updates allow greater resolution of the sine wave, while lower frequency improves the performance of the rest of the program by minimizing the number of hardware interrupts that pause execution to allow the ISR to execute.
We only used the 7 most significant bits of the MCU output to drive our resistor ladder. Adding the 8th bit would not have increased the peak voltage much and would not have had any effect on the resolution of the wave. These bits enter the voltage ladder, which acts as a voltage summer, with each bit weighted differently.
The major hardware/software tradeoff we encountered entailed the generation of our input voltage sinewaves. We chose to utilize a resistive ladder for digital to analog conversion, and this limited our ability to produce smooth input waves above 10kHz. This was not too much of a concern for us, however, since most biological tissue testing uses frequencies ranging only up to 100kHz. We realized the higher order of magnitude would be very difficult to generate and is often less important in analysis, and decided only to pursue frequencies below 10kHz.
Another tradeoff occurred in the implementation of syncing Matlab with the MCU. In order to ensure the first values that Matlab received were from the first data points taken, we had to first run the Matlab script files, followed by turning on the MCU afterwards. Given more time for project implementation, we could have implemented this feature, but it was not a priority for us during development.
Medical devices require attention to the details of IEEE standards, such as isolation of the user/patient from 120V sources. Since our device is currently only going to be used on hydrogels and excised animal tissue samples, this isolation is not necessary. Also, IEEE Standard 1073 regulates medical device communication, and although it did not impact our project directly, it might be a Standard to abide by for long-term implementation of a device similar to ours.
Program Details
Our software is made up of two parts: the C program that controls the MCU and the Matlab script that receives data from the MCU and analyses it. The primary task of the MCU is to control the electrodes, collect data from the probe and pressure sensor, and transmit that data to the computer. The Matlab script first receives this data and then performs some calculations on it, eventually graphing the impedance measure by each set of probes against the pressure on the tissue at that point.
C Program
The C program consists of a single ISR that handles basic timing and sine wave generation, a main function that schedules the probe readings and 6 nearly identical functions that each takes readings from a pair of electrodes. The ISR is set up so that it executes on the timer0 compare match at 127. This means the routine is executed at 125kHz. It’s primary purpose is to generate the sine wave. In software, this is done similarly to the DDS from lab 2, where a 32 bit accumulator is incremented by a different amount depending on the desired frequency and the top 8 bits are used to generate a sine wave via lookup table. However, unlike lab 2, we don’t output this wave through the PWM. Instead, we take the result of the sine table look up and output it through a resistor ladder as a manual digital to analog converter. The second function of the ISR is to decrement the function timers every millisecond to establish the time base.
The main function performs a couple basic actions. First, it initializes the sine table that is used for the sine wave generation. Next it calls the initialize function which performs the standard MCU set up. It sets up the uart so we can use the serial connection to communicate with the PC, sets up timer0 as was already described, sets up PORTA as an input and PORTB, C and D as outputs, initializes the time counters and various flags, sets up the ADC for its first input and turns on the interrupts. Finally, the main function enters a timing loop that executes forever and calls the various tasks whenever they are due.
Each task is designed to perform the same functions, just to a different set of electrodes in the probe. First each task outputs the number of the probe that is about to take the readings. This is so the Matlab script can organize the data by probe to develop an elongation distance estimate. After this, the MCU measures the pressure in the tube. This requires setting the ADC to read PORTA.0 and then taking a reading. While the conversion is happening, the program simply waits idly for it to finish before outputting the pressure to the serial port. Next, it will measure the resistance (IMPEDANCE???) and phase shift of the sine wave through the tissue at 100Hz, 500Hz and 1000Hz. To do this, we change the input to the ADC to PORTA.1 for the resistance (IMPEDANCE???) and PORTA.2 for the phase shift and start a conversion. The increment is changed before every different frequency measurement and the sine wave is given a short period of time to settle into a steady state before measurements are taken. To minimize the disturbance from system noise, we actually perform 20 conversions (10???) for each reading and average the values together. These values are output to the serial port.
At the start, only the first electrode (on the tip) is tested in this way. When it encounters a non-infinte impedance (indicating the presence of tissue), it triggers a flag, which allows the second electrode to start taking measurements as well. When the second electrode starts to encounter tissue, the third electrode is activated, and on down the line. This scheme is more efficient than scanning all six electrode in series every time because if the second electrode hasn’t encountered tissue, then the third or fourth obviously would not have encountered any either.
Parts List:
| Part, Description | Qty | Cost/Part | Total |
|---|---|---|---|
| Total | $47.33 | ||
| Mega644 | 1 | $8 | $8 |
| MAX233 | 1 | Sampled | $0 |
| Custom PCB | 1 | $4 | $4 |
| RS232 Connector | 1 | $1 | $1 |
| Solder Board 6” | 1 | $2.50 | $5 |
| Solder Board 2” | 1 | $1 | $1 |
| DIP Socket | 2 | $.50 | $1 |
| LM358 | 4 | Lab Stock | $0 |
| INA121 | 1 | $5 | $5 |
| LM339 | 1 | $.51 | $.51 |
| MPXV6115VC6U-ND | 1 | $11.22 | $11.22 |
| MM74HC4045N-ND | 1 | $.60 | $.60 |
| CD4051BC | 2 | Lab Stock | $0 |
| Resistors | Lab Stock | $0 | |
| Capacitors | Lab Stock | $0 | |
| Diodes | Lab Stocks | $0 | |
| White Board | 1 | $6 | $6 |
| MicroElectrode Array | 1 | Provided by Reseach Department | $0 |
| Tubing | $0 | $0 | |
| Syringe | 1 | $0 | $0 |
| Jumpers | 4 | $1 | $4 |
For more detail: Tissue Impedance Digital Biopsy Using Atmega644