Introduction
For this project, we created a noninvasive heart rate and blood pressure measurement tool with the intention of gathering data for large-scale analysis for the automatic prediction of heart disease.
In modern society, patients often have access to a wealth of electronic data concerning their social networks and surroundings, but have little personalized insight into their own health. Our plan is to distribute a small handheld device with an array of biometric sensors to collect data about a user’s body. With the patient’s current and past data, we can give the patients a pre-diagnosis (outlining symptoms and possible sickness) using machine learning techniques to create a general summary of the patient’s symptoms and potential treatment while collaborating with physicians to reach a final consensus of the patient’s health status before the patient is aware of his/her illness. We want to empower users with basic knowledge of their vital signs and help them be more proactive in disease prevention while relying less on frequent primary care physician office visits.
For this project, we implemented the heart rate and blood pressure monitoring devices. For the final device, we want to have a complete array of physiological sensors. We wanted to build the basis for the optical sensing hardware, since most of the metrics gained in the final device will be based on optical design. We experimented with different methods of both analog and digital optical sensing, and found that digital sensing was the most effective for our purposes. In addition, we developed a reliable method of real-time digital signal processing to extract pulse transit time and heart rate information.
Currently, our project can measure a pulse transit time that correlates logarithmically to the blood pressure of the subject. There are still issues with the peak detection algorithm and the physical interface, but in ideal operating conditions the device can measure pulse transit time effectively.
High Level Design
Project Rationale
The ratio of health workers in the United States numbers 2.4 physicians for every 1000 people, yet in other developed countries such as Norway this metric goes up to 4.16 per 1000, leaving the US on the low end in the developed world. In other less developed countries, that number is far lower: for example in Africa, there are 0.003 physicians per 1000 people. This disparity between the number of people and the available health workers limits the effectiveness of the healthcare system. On another front, the rate of increasing cost of healthcare in the US due to advances in medical technology and increases in reimbursement incentives for physicians and hospitals is greater than the rate of increase of governmental spending in healthcare. As the costs of medical treatments and amount of money spent towards treatment increase, the quality of treatments also increases, yet the number of people who can afford such healthcare decreases. Paradoxically, the general health of the nation declines despite increases in medical technology.
Currently, there are 2.4 physicians per 1000 people in the US, with other lesser developed countries with as few as 0.003 physicians per 1000 people. This wide disparity between health workers and patients has been one of the main limiting factors of the effectiveness of the health care system. In addition, the rising cost of healthcare because of advances in medical technology has risen far faster than the government and the patient’s ability to pay for these technologies.
While reading through some news articles, we stumbled upon a gizmag article that discussed how IBM Watson was being utilized to aid in the diagnosis of patients, and we thought it would be useful to build an infrastructure where patients could do a health analysis on themselves by themselves. Because of the wide disparity between the number of available health workers per person, we thought it could benefit society to empower the common person with the means of tracking his or her own health, prevent illnesses, and be able to send quantitative data to doctors easily for analysis. By providing this data to both patients and doctors, we hope to facilitate and augment the throughput of doctors’ efforts.
Our solution, which provides people with a consumer electronic device that can collect biometric data and interpret it, will give users a method of gathering insight into their own bodies and health. We will provide users the ability to purchase a low-cost device that can pay itself back in orders of magnitude by reducing unnecessary doctor visits while giving users the ability to have some control and knowledge over their own health. We hope to eventually create the infrastructure through which we can collect and securely transfer patient data between patients and their respective physicians, as well as perform machine learning tasks that can predict health risks for patients, in a similar fashion to IBM Watson.
Background Math
In order to measure blood pressure, most methods involve invasive intravenous (IV) force measurement or pressurized air cuffs. The IV methods are highly invasive and require skilled administration by a nurse, while pressurized air cuffs can be uncomfortable and inconvenient. We decided to pursue an optical pulsatile method of blood pressure measurement, using pulse transit time rather than direct force measurements. Similarly, to gather pulse data we utilized optical reflectivity. We can optically measure pulses because of the reflective characteristics of blood, as indicated in the figure below. Different volumes of blood have different reflective characteristics, so by measuring the changing in reflectivity we could measure the time between pulses in varying parts of the body.
Our focus on optical measurements comes from our idea to reduce the level of invasiveness as far as possible. Compared to traditional methods, our optical measurement method is fast and simple enough to ideally be used by anyone with little training. In order to get pulsatile readings on two parts of the body simultaneously, we use a front and top facing sensor on the final device. The user positions his/her finger on the top sensor while pointing the front sensor to a different part of the body, thus measuring a difference in pulse time.
As blood pumps through the body, the volume of blood in the points of measurement also changes. These volumetric changes modify the optical reflectivity of the measured area, since the composition of the surrounding tissue stays the same while the volume of blood changes. We can measure these volumetric changes and detect peaks in the signals to detect heart beats, and use the delay between peaks at different parts of the body to detect differences in pulse transit time.
The reason we chose to measure blood pressure and pulse were because of some preliminary machine learning statistics we gathered about heart disease prediction. Using the UCI dataset, we trained an SVM classifier to predict whether or not a patient had heart disease using only non-invasive data. We utilized a linear kernel, and our only features were age, sex, chest pain types, resting blood pressure, and maximum heart rate. Just utilizing these basic features, we were able to achieve a relatively high rate of accuracy in predicting heart disease, and so we wanted to build a prototype that could help us acquire the data necessary to begin data mining for the eventual purpose of diagnosing patients. Below we present the statistics gathered, where we show the obtained accuracies given number of training documents. By using just a few health metrics, we could obtain accuracies of >76% using purely these metrics alone.
We used the Moens-Korteweg model of blood pressure to justify the validity of our pulse transit time measurements to estimate blood pressure. The Moens-Korteweg model describes the relationship of PTT with blood pressure. Essentially, the PTT is directly proportional to the pulse wave velocity with linear offset based on the path length.
h = vessel thickness
p = blood density
r = vessel radius
The elasticity modulus is further dependent upon the blood vessel wall pressure, related exponentially.
According to the Buenos Aires group, the PTT still follows the calibratable logarithmic model if certain features are fixed. The mean pulse wave velocity must be assumed to be similar for both pathways regardless of the different blood vessel thicknesses. As a result we have used this regression-based model to gauge the accuracy of the PTT measurements for this project.
Logical Structure
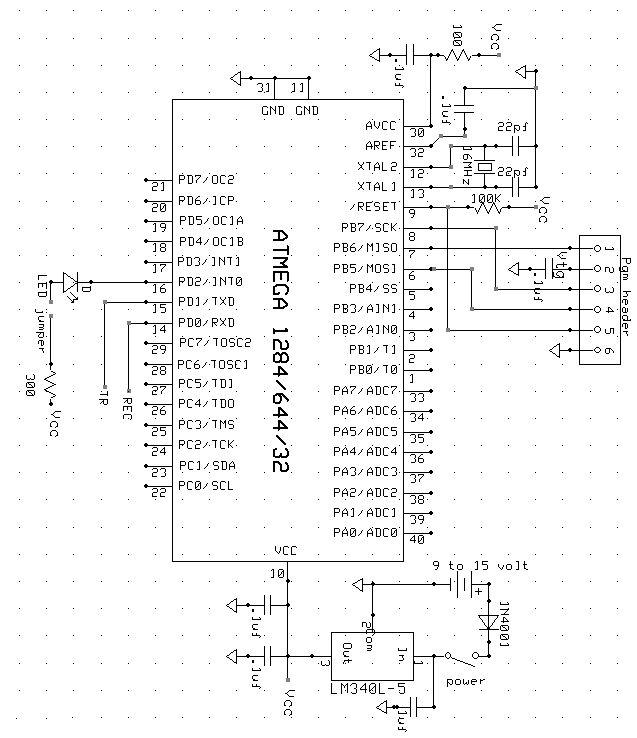
This diagram shows the overall structure of our system. At the heart of our device is the ATMEGA 1284p, this device is controlling the infrared LEDs that will transmit light which is reflected back to the light to frequency sensors. The microcontroller takes in the signals that reflect pulsatile measurements, and will digitally process these signals into pulse measurements, and send the data through either USB or bluetooth to a PC. The PC will have a GUI that graphically shows the two pulses and the blood pressure and pulse.
There are two main components of our design: the base station unit and the mouse unit. The mouse unit contains the mouse controller, a mega1284P microcontroller, an ultrasonic sound transmitter, three ultrasonic sound receivers and an XBEE wireless transceiver. The base station contains a mega32 microcontroller and an XBEE wireless transceiver.It is connected to PC using a USB cable. Users input their commands using the mouse controller, the raw distance data will be generated in the mouse unit within the mega1284P microcontroller for it to output the x and y coordinate data. The microcontroller also handles the ISR generated by button click actions. The mouse unit finally encodes the data into packets and the data is then transmitted to the base station unit using XBEE radio transceiver. When the base station receives the data, it encodes and transmit the data to PC through serial connection. The serial data is read and decoded by java application and utilized for the java HID class. A diagram demonstrating the logical structure is shown as above.
Hardware/Software Tradeoffs
To begin our project, we had to make a few decisions between hardware and software. Because this sub-project was part of a larger theme, we wanted our project to be very modular such that we could add sub systems for new sensors as we developed more ideas. In order to ensure a more modular product, we decided that most we wanted to limit the hardware as much as possible. Adding more and more hardware to the medical scanning device would only make our product more expensive, so we decided that having a microcontroller that could digitally process and receive signals would allow for more future modularity, as we could add smaller pieces of cheaper hardware and filter all signals through the microcontroller. The tradeoff is that the software becomes increasingly complex, and at some points we even found that the ATMEGA1284p did not have enough RAM to handle some floating point operations, so an even more expensive microcontroller would have to be obtained.
Hardware
Hardware Selection
Throughout the course of this project, we experimented with several hardware elements to find an optimal combination of components. Firstly, for the optical sensor, we initially experimented with analog components. However, the analog hardware required was large, and multiple components were required to sample the values. In addition, the onboard ADC did not have sufficient resolution (10-bits) that we desired. The analog circuit had to be tuned very precisely as well and as a result could not easily have a variable dynamic range without additional hardware. As a result, we experimented with digital methods. Though sampling rates could potentially be very high at the speed of the ADC, the practicality for an eventually multipurpose light sensor was not evident.
The TSL2561 digital light sensor communicated via I2C (or two wire interface TWI) and essentially combined a high resolution ADC with a high sensitivity analog photodiode. However, to achieve accurate measurements on the TSL2561, the sensor required long integration times to achieve a high enough signal to noise ratio. With our experimentation, we found this rate to be 50mS. Since the length of the pulse transit time averages around 200mS, this sampling rate would be too low temporal resolution to be practical.
We eventually chose the TSL235R, a light to frequency converter, because it allowed completely digital measurement of light. The typical square wave output from the sensor was several kilohertz, which was reasonably accurately detectable by our microcontroller. The advantage of the light-to-frequency sensor was its variable dynamic range. Since we ultimately used counters to measure the frequency, we could measure over a wide range of frequencies and light intensities by measuring timer overflows.
We also experimented with multiple microcontroller chips. In the interest of price, we initially attempted to use an Atmega328 chip. However, the Atmega328 only had three hardware timers, but our initial timer implementation of the frequency sensing required four timers. As a result, we experimented with polling methods of counting, but found that the approach resulted in high levels of jitter. Because we found that the polling method was unstable, we used the Atmega1284p in order to use the greater hardware capabilities and additional timers to build this project.
Hardware Constraints
During the initial design of the project, we experimented with offline analysis of the acquired light sensor data. However, in order to achieve an appropriate sampling rate, we needed to allocate a large portion of memory to store the sampled data. Since the Atmega1284p has 16kB of RAM, we would be unable to store data for several seconds at a 1kHz sampling rate for two sensors. Over the course of the project, we also reached this memory barrier after implementing multiple floating point large digital filters. We had to restructure the memory allocation in order to overcome this barrier.
In addition, a large portion of our final developed system was dependent upon the hardware constraints of the microcontroller. The frequency and execution of interrupts, for example, prevented us from using externally triggered interrupts to track the light sensor frequency, since the execution of each interrupt service routine would slow down the microcontroller as the input frequency increased.
System Design
This is an overall view of our design project. Two light sensors connect to the ATMEGA1284p through pin B0 and B1, externally triggering timer 0 and timer 1. Our UART is connected through D0 and D1 to the bluetooth module, although the project can also be configured to use USB to connect to a computer. Port A controls the various LEDs.
Optical Sensors
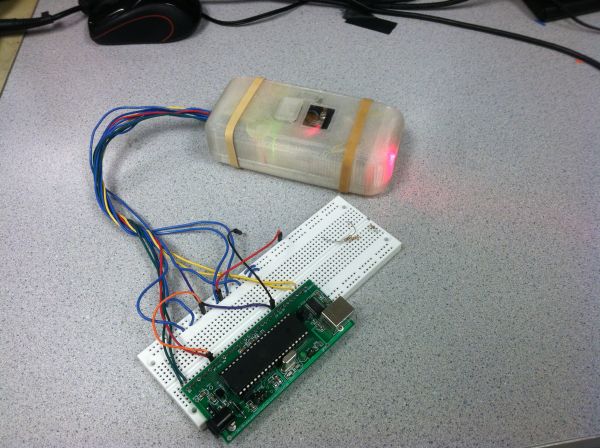
The TSL235R light to frequency converters used in this project were arranged on the front and top of the device, to allow for neck and finger pulse sensing. The optical sensors are placed in between two LEDs, one red 660nm and one 980nm IR led. Also included is a toggle switch for power and a momentary push button switch to signal data acquisition.
Bluetooth Module
The HC-06 Bluetooth module is shown in the image below. It is mounted underneath the main board and is connected to UART0 on the microcontroller. This module is paired to a PC that has Bluetooth connectivity via a USB dongle.
Parts List:
| Part | Vendor | Cost/Unit | Quantity | Total Cost |
|---|---|---|---|---|
| 9v Battery | Target | $1.57 | 1 | $1.57 |
| Prototype Board (Atmega 1284) | Lab Stock | $15.00 | 1 | $15.00 |
| Header Pin | Lab Stock | $0.05 | 40 | $2.00 |
| White Board | Digikey | $6.00 | 1 | $6.00 |
| Breadboard | Lab Stock | $0.00 | 2 | $0.00 |
| Momentary Push switch | Digikey | $1.00 | 1 | $1.00 |
| Toggle switch | Digikey | $1.50 | 1 | $1.50 |
| 5V Regulator | Digikey | $2.00 | 1 | $2.00 |
| Wires Resistors | Lab Stock | $0.00 | Many | $0.00 |
| Capacitors | Lab Stock | $0.00 | Many | $0.00 |
| LEDS | Lab Stock | $0.00 | Many | $0.00 |
| Bluetooth RS232 TTL transceiver | Dealextreme | $6.80 | 1 | $6.80 |
| Infrared LED LTE-4208 | Digikey | $0.50 | 2 | $1.00 |
| TSL235R Light to Frequency Converter | Digikey | $3.00 | 2 | $6.00 |
| Kinivo USB Bluetooth Dongle | Amazon | $15.00 | 1 | $15.00 |
| 3D Printer Filament PLA | Makerbot | $25/kg | 100g | $2.50 |
| TOTAL: | $60.37 |
For more detail: Scan-E: An optical blood pressure sensor Using Atmega1284