Summary of Connecting to Microcontroller With Pyserial Library – Python
This article demonstrates using Python's Pyserial library to establish a serial connection with an MSP430 microcontroller reading a DHT11 sensor. It covers installing the library, writing code to log temperature and humidity data with timestamps to a text file, and utilizing Matplotlib and Numpy to visualize the data trends over time.
Parts used in the Connecting to Microcontroller With Pyserial Library Project:
- MSP430 Microcontroller
- DHT11 Sensor
- Python Pyserial Library
- Matplotlib Library
- Numpy Library
Hi, In this instructable, we’ll see how to use the Pyserial library in Python in order to make a serial connection via a COM Port (in our example COM3) and receive the temperature and humidity values from an MSP430 Microcontroller which is programmed to obtain data from a DHT11 sensor.
In addition to this, we’ll see how to write these serial output to a text file and then we’ll use matplotlib and numpy libraries to process the data from the text file and plot temperature & humidity change by time.
Step 1: Circuit Setup
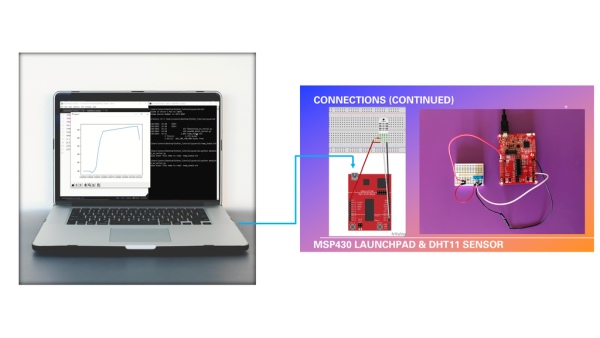
In order to see how to obtain the value from the MSP430 microcontroller and send them to the serial port you can use the following instructables:
https://www.instructables.com/MSP430-DHT11-Tempera…
https://www.instructables.com/MSP430-Serial-Monito…
You can also use other microcontroller boards such as Arduino, in that case the only thing you’ll need to pay attention is the COM port that you’re using and the speed (baudrate) of the connection.
Step 2: Installing Pyserial Library
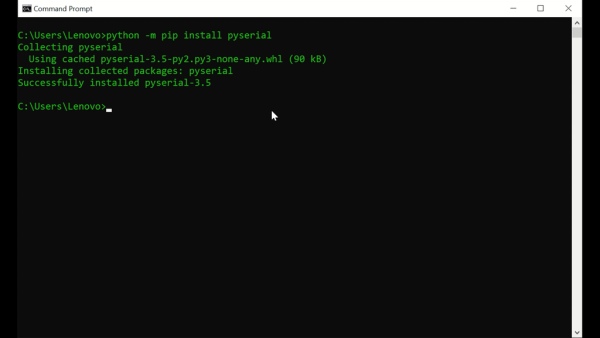
We’ll use the following command in the command prompt (Windows) for installing Pyserial Library:
python -m pip install pyserial
Step 3: Python Code Using Serial Library
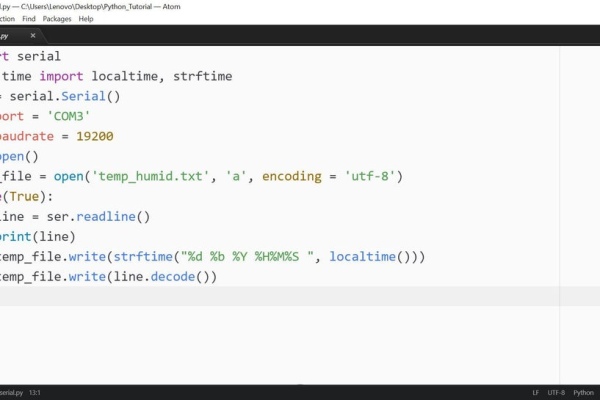
In this step, we’ll write the code that opens a serial connection, prints the received messages to the terminal (command prompt) and at the same time to a text file that we specify. You can change the port and baudrate settings with (ser.port and ser.baudrate)
While writing to the text file, the code also puts timestamps in the beginning of the line in order to log when the measurement was received.
Code:
import serial
from time import localtime, strftime
ser = serial.Serial()
ser.port = ‘COM3’
ser.baudrate = 19200
ser.open()
temp_file = open(‘temp_humid.txt’, ‘a’, encoding = ‘utf-8’)
while(True):
line = ser.readline()
print(line)
temp_file.write(strftime(“%d %b %Y %H%M%S “, localtime()))
temp_file.write(line.decode())
Step 4: Plotting Temperature and Humidity Change
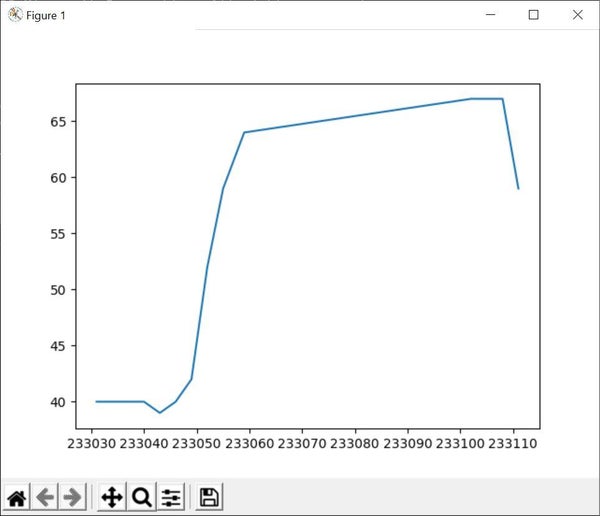
In this final step, using the log file that we created in the previous step, we’ll plot the temperature and humidity change over time. In order to plot temperature, you need to set the line y = matrix_data[:,6] . In order to plot humidity, you need to set the line y = matrix_data[:,-2] (6 and -2 correspond to the colums representing temperature and humidity values respectively, you can check for the text file, first column having the indice 0)
Code:
import numpy as np
import sys
import matplotlib.pyplot as plt
np.set_printoptions(threshold=sys.maxsize)
read_file=input(‘Please enter file name to read: ‘)
test2_file=open(read_file, ‘r’, encoding = ‘utf-8’)
matrix_data = np.genfromtxt(test2_file)
x = matrix_data[:,3]
y = matrix_data[:,-2]
plt.plot(x,y)
plt.show()
Thank you for your time..
Source: Connecting to Microcontroller With Pyserial Library – Python
- How do I install the Pyserial library?
You can use the command python -m pip install pyserial in the Windows command prompt. - Can I use other microcontrollers like Arduino for this project?
Yes, you can use boards like Arduino, but you must pay attention to the COM port and baudrate settings. - What is the purpose of the timestamp in the text file?
The code adds timestamps at the beginning of each line to log exactly when the measurement was received. - Which column index represents the temperature value in the plot code?
The temperature value corresponds to the line y = matrix_data[:,6] where 6 is the column index. - How do I plot the humidity change over time?
To plot humidity, set the line to y = matrix_data[:,-2] as -2 corresponds to the humidity column. - Does the script print data to the terminal while saving it?
Yes, the code prints received messages to the terminal and simultaneously writes them to a specified text file. - What happens if I need to change the serial port?
You can change the port setting by modifying the ser.port variable in the code. - How does the program handle the serial connection speed?
The baudrate is configured using the ser.baudrate setting, which is set to 19200 in the example.