Summary of Graphical LCD Oscilloscope using ATmega16Microcontroller
This project designs a portable oscilloscope using an ATmega16 microcontroller and a JHD12864E Graphical LCD to visualize analog signals. By leveraging the internal 10-bit ADC and sampling theorem principles, the system converts input voltage into digital data for real-time display. It offers a compact, low-cost alternative to bulky cathode-ray oscilloscopes, suitable for analyzing low-frequency signals like square waves up to 200 Hz.
Parts used in the Portable Oscilloscope:
- ATmega16 Microcontroller
- JHD12864E Graphical LCD
- Analog-to-Digital Converter (ADC)
- 555 Timer
- Toggle Switches
- Oscilloscope Probe
- Functional Generator
- Anti-aliasing Filter
Introduction
The popularity of microcontrollers is on the rise, thanks to their compact size and impressive capabilities. Embedded systems are being constructed around microcontrollers and peripheral devices [3]. An oscilloscope is frequently employed to observe the waveform of an electrical analog signal, typically representing voltage, time, and frequency. Parameters such as peak-to-peak voltage, frequency of a periodic signal, and the time it takes for a signal to reach full amplitude are measured. While conventional cathode-ray oscilloscopes (CRO) are commonly used for such tasks, they are bulky and inconvenient to transport. The objective of this project is to design a portable oscilloscope.
Working Principle
The operation of a Graphical LCD is based on the fundamental concept of the sampling theorem. According to this theorem, the sampling frequency must be at least twice the highest frequency component present in the signal, as indicated by equation (1):
\[ f_s \geq 2f_c \]
Here, \( f_s \) represents the sampling frequency, and \( f_c \) is the highest frequency component in the signal. To facilitate the sampling process, an Analog-to-Digital Converter (ADC) is employed, with a conversion time of 30 microseconds [5]. It is crucial to utilize this time effectively for displaying data on the Graphical LCD. Failure to do so may lead to an increase in the time difference between three consecutive samples, subsequently reducing the system’s sampling rate [8]. Consequently, the overall frequency range of the system will decrease.
For optimal performance, it is advised to ensure that the maximum frequency of an external clock source is less than the clock frequency, and the clock frequency falls within the range of 50 KHz to 200 KHz. This range ensures maximum resolution, and the conversion time of the ADC is specified to be between 13µs and 260µs.
ATmega16 Microcontroller
Graphical LCD
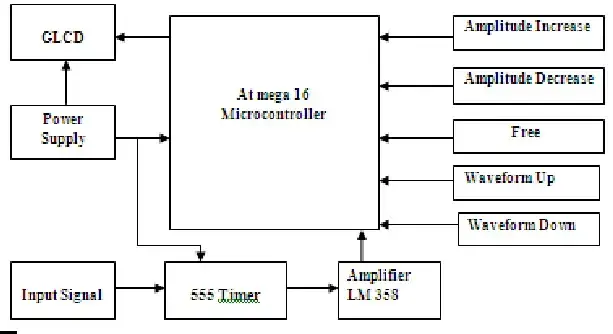
We developed a graphical LCD driver specifically tailored for the crystal fonts 12864B 128×64 pixel graphical LCD. In Figure 1, the block diagram of the ATMEGA16 microcontroller, along with the entire system, is depicted[3]. The graphical LCD and 555 timer receive power supply. Additionally, five toggle switches are employed for various settings as specified.
Description of new system
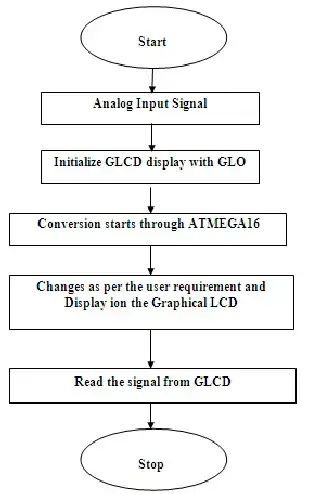
The process unfolds in the following sequence:
1. Commencing with the acquisition of an analog input signal from the device.
2. Subsequently, initializing the graphical LCD.
3. Converting the analog signal into a digital signal through the built-in ADC in the ATmega16 microcontroller.
4. Implementing alterations based on user specifications.
5. Ultimately, presenting the result on the graphical LCD.
Description of Circuit diagram
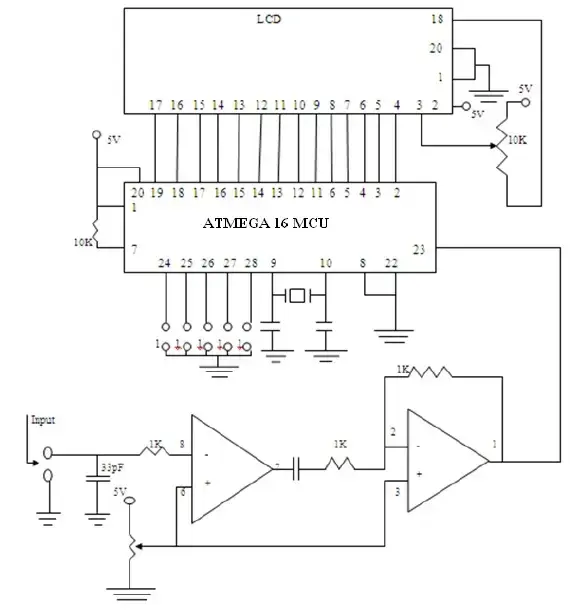
To display data on these points, only 6 bits are necessary. However, as mentioned earlier, the ADC possesses a 10-bit resolution[5]. Representing 10-bit data requires 1024 points, but our display column accommodates only 64 points. To address this limitation, it is necessary to convert the 10-bit digital ADC value into 6 bits. This conversion can be achieved in two ways: i) Discarding the first four bits from the MSB of the 6-bit data, which reduces the range while preserving the resolution. ii) Discarding the first four bits from the LSB of the 6-bit data, which also reduces the range while maintaining resolution.
Programming Details
Result and Discussion
Conclusion
This embedded system enables the analysis of low-frequency signals and voltage amplitudes. It aids students in creating a new, compact-sized system with significantly lower costs compared to existing portable oscilloscopes.
- What is the main objective of this project?
The objective is to design a portable oscilloscope that serves as a compact alternative to bulky conventional cathode-ray oscilloscopes. - How does the Graphical LCD operate in this system?
It operates based on the sampling theorem, requiring a sampling frequency at least twice the highest signal frequency component. - Can users adjust settings on the device?
Yes, five toggle switches are employed for various settings based on user requirements. - Does the system use an external or internal ADC?
The system uses the built-in 10-bit ADC within the ATmega16 microcontroller. - What clock frequency range ensures maximum resolution?
The clock frequency should fall within the range of 50 KHz to 200 KHz for optimal performance. - How is the 10-bit ADC data handled for the 64-dot column display?
The 10-bit data is converted to 6 bits by discarding four bits from either the MSB or LSB side. - What programming language is used for the code?
The coding language utilized for the program is C. - Can the system prevent aliasing effects?
Yes, employing an anti-aliasing filter is recommended to prevent aliasing effects in practical applications.