Summary of AVR Simulation with the ATMEL
AVR Studio 4 is an IDE for debugging AVR microcontroller software, featuring chip simulation and in-circuit emulation. Users generate COF files via a C compiler to launch simulations. The interface includes Workspace, Source Code, Output, and Watch windows for monitoring variables and system feedback. Configuration requires setting the target device and manually entering clock frequencies like 6.0MHz if not pre-defined. Simulation controls include Step Into, Step Over, Run to Cursor, breakpoints, and resetting, allowing detailed instruction-level analysis.
Parts used in the AVR Studio 4 Project:
- AVR Studio 4 Integrated Development Environment
- COF object file
- C compiler
- MegaAVR Development board
- PRLLC hardware
- AVR Simulator option
- Workspace window
- Source Code window
- Output window
- Watch window
Introduction
AVR Studio 4 is a user-friendly Integrated Development Environment (IDE) designed for debugging AVR software. It offers chip simulation and in-circuit emulation capabilities for the AVR microcontroller family. The user interface is intuitively designed to provide comprehensive information and is suitable for both simulation and emulation, enabling users to quickly grasp its functionalities.
Getting Started
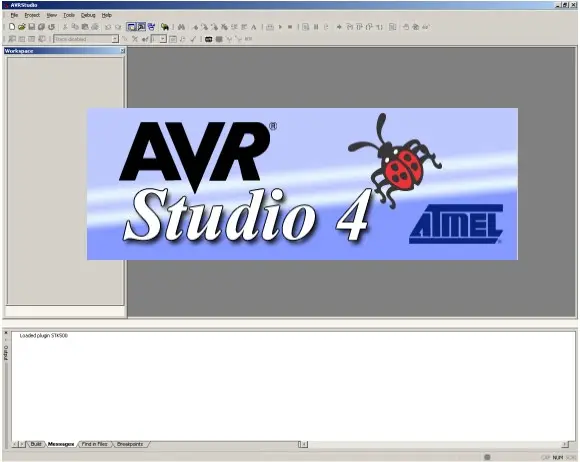
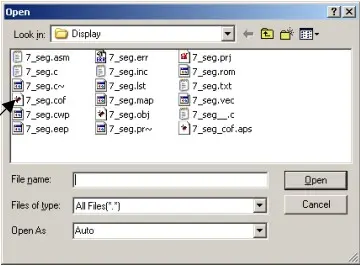
To perform simulation in AVR Studio, you need to utilize a COF object file. This file is generated by the C compiler when you choose COF as the output file type. Detailed instructions for creating this file can be found in the C compiler documentation. To launch AVR Studio, you can either select it from the Start Menu or use the program icon (if available). Both methods will open the IDE interface depicted in figure 2 below. After launching the IDE, you can access the “File Open” function either through the File Pull-down Menu or by clicking on the File Open Button.

Choose the COF file you wish to simulate by navigating through the File Open window, which follows the standard Windows navigation format. You can open the file by either double-clicking on it or by selecting the file and clicking the Open Button.
Device Selection
Once the source file is opened, it is necessary to specify the device and debugging platform. For simulation purposes, choose the AVR Simulator option and make sure to select the appropriate AVR target device. After selecting the correct target AVR microcontroller and platform, click on the Finish Button.

IDE Windows
The IDE includes multiple windows that offer valuable information to the user. These windows may open automatically or require user activation. Regardless of their activation method, users have the flexibility to move and resize the windows according to their preferences. The primary windows of significance are the Workspace, Source Code, Output, and Watch windows, all of which are illustrated in figure 5 below.

Workspace Window
Watch Window
The Watch Window enables users to monitor software variables. To add a variable for monitoring, right-click within the window and choose the “Add” option from the menu. The next line or box in the Watch Window is delineated by a box and contains a flashing cursor. Enter the variable name exactly as it appears in the source code. It’s important to note that local variables are only valid within the function where they are defined.

Output Window
The Output window delivers feedback to the user, which includes information about the microcontroller, object file, and more. It serves as a channel for displaying various messages and updates.

Simulator Options
Prior to initiating a simulation, it is necessary to configure the frequency of the target AVR. The MegaAVR Development board provided by PRLLC operates at a clock frequency of 6.0MHz. However, this specific frequency may not be available as a pre-defined option in the pull-down menu. Consequently, the user must manually enter this value into the program.
Source Code Simulation
IDE Toolbar
Once the IDE is properly configured and the windows are arranged to the user’s liking, the simulation of the source code can commence. The yellow arrow denotes the upcoming statement to be executed. The toolbar, depicted in figure 14, presents a range of execution options for the source code. These options encompass Step Into (Single Step), Step Over, Step Out, Run to Cursor, Auto Step, and Run. In addition to these functions, users can also Set Breakpoints, Reset, and Stop Debugging.

Next Statement
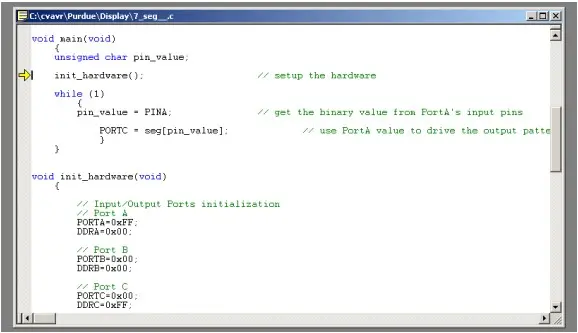
The figure 15 below exhibits a yellow arrow that highlights the subsequent instruction in line to be executed. This visual cue serves as an indicator for the user, providing a clear representation of the forthcoming instruction or function.
Step Into
The Step Into operation, also known as Single Stepping, is perhaps the most commonly used action during software simulation. This command enables the execution of one instruction at a time, even within a function call. Its name, Step Into, reflects this behavior. You can execute a Step Into command by clicking on the corresponding icon or by pressing the F11 key. By applying this command to the sample program displayed in figure 17, the subsequent instruction will be executed.

In this scenario, the upcoming instruction entails a function call to a function called init_hardware(), responsible for initializing the microcontroller’s hardware. After executing the Step Into command, the yellow cursor now points to the initial statement within the function. Executing another Step command will execute the current statement and progress to the subsequent statement within the function. This iterative process can be repeated throughout the software.
Source: AVR Simulation with the ATMEL
- How do I start a simulation in AVR Studio?
You must utilize a COF object file generated by the C compiler as the output file type. - What steps are required before initiating a simulation?
You need to specify the device, choose the AVR Simulator option, select the target AVR microcontroller, and configure the frequency. - Can I manually set the clock frequency if it is not in the menu?
Yes, users can manually enter values like 6.0MHz into the program when pre-defined options are unavailable. - Which windows are available for monitoring software variables?
The Watch Window enables users to monitor software variables by adding them via the right-click menu. - What is the function of the yellow arrow in the toolbar?
The yellow arrow denotes the upcoming statement to be executed during source code simulation. - How do I execute one instruction at a time within a function call?
You use the Step Into command, also known as Single Stepping, which can be triggered by clicking the icon or pressing F11. - Where does the Output window display information?
The Output window delivers feedback including information about the microcontroller, object file, and various messages. - Are local variables visible globally in the Watch Window?
No, local variables are only valid within the specific function where they are defined.