Summary of Complex impedance analyzer Using Atmega32
This article details the development of a portable impedance analyzer, originally intended as a body fat measurer. Due to limitations in creating a stable current source for human testing, the project pivoted to measuring complex impedance of R-C circuits across 500-2000 Hz. The device utilizes a hybrid software-hardware approach to generate programmable sine waves by filtering square waves with an 8th-order Butterworth filter. It employs an STK500 microcontroller and specific analog components to measure amplitude and phase shift, displaying results on a TV screen.
Parts used in the Impedance Analyzer:
- STK500
- 12V Power Supply
- B/W TV
- White Board (2)
- STK500 Power Supply
- MAX7480
- MM74HC4046
- LM833(4)
- LM311(3)
Introduction
Our original plan for creating this device was to develop a body fat measurer, a portable device that could allow users to monitor their health at their convenience. However due to device limitations we were unable to achieve this goal. Rather than an actual body fat measurer our end product is an impedance analyzer which is the foundation of a body fat measurer. The impedance analyzer is able to measure the complex impedance of any device under test (DUT) for a range of signal frequencies from 500-2000 Hz.
High Level Design
The idea to develop a portable body fat measurer stemmed from the health conscious member of our group, Vincent Lee, who thought that it would be a good device if it was conveniently available to the public. Current body fat measurement devices are either professionally used medical devices or are attached to scales so that both a body fat percentage and a weight can be determined by using the scale. Our idea was to create a portable body fat measurer and fitness motivator that would measurer the user’s body fat and motivate them by words of encouragement or jeering remarks to make the user go work out.
The general idea behind a body fat measurer or any impedance analyzer is that a generated AC current is passed through a body or a device under test (DUT) and the resulting signal coming from the body is analyzed by measuring its output voltage and phase shift from the generated signal. These measurements are then interpreted and the resulting impedance of the DUT can be determined. From this calculated impedance value, a body fat percentage could be determined based on the user’s characteristics and empirical models that have been developed over the years.
Impedance is the ratio between voltage across and current through a device. The distinction between impedance and resistance is that it has a phase shift component as well. Consequently, impedance is a complex number, the real part of impedance refers to resistance and the imaginary part refers to reactance.
Z = R + jX
Resistance is the dissipative part of the impedance, while the reactance is the energy storage component. Impedance can be rewritten in terms of a phasor multiplied by the magnitude. The magnitude of the impedance can be calculated as:
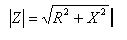
while the phase shift is
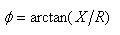
The impedance of a resistor is simply R, the resistor value, and the impedance for a capacitor is -j/wC where C is its capacitance and w = 2*pi*frequency; similarly the impedance for an inductor is jwL where L is its inductance and w = 2*pi*frequency.
The critical factor in constructing an impedance analyzer is having a constant current AC signal. Given a constant current AC source, the voltage level of the output signal after the DUT can be measured to determine the resist
The main software and hardware tradeoff considered in our project was creating our sine wave signal. Although numerous methods exist to create a sine wave, our device requires generating a programmable multi-frequency sine wave generator capable up to 50kHz. The accuracy of the frequency is also crucial.
There are both the hardware and the software approaches. The software approaches include DDS through PWM or DAC, while the hardware approaches usually involve some form of oscillators and filters. The strength of DDS is that the frequency of the sine wave is variable with software. However, the drawback is the number of samples needed and the demanding processing power required from the MCU.
Initially the sine was generated using the DDS technique on MCU. However through trying to generate a 50 kHz sine wave using a parallel DAC, we realized that this method would not be efficient as it took up most of the processing time of the MCU. Sine a 50 kHz sine wave requires at least twice the frequency for its sampling frequency in order to reconstruct the waveform. To have a decent sine wave for our application, it is necessary to increase the samples per cycle to 8 samples at least, and this would require 400 kHz, which means the ISR would have to be executed every 40 clock cycles. Although a 50kHz sine wave can be generated, it leaves the MCU very few cycles to take measurement of the amplitude and phase shift.
Although the hardware approach spares the MCU from spending its processing power on sine wave generation, it is not software programmable. The frequency can only be changed by varying the value of the physical resistors and capacitors. Therefore it is not possible to control it using MCU.
The hardware approach is satisfactory to generate only one known frequency. However, it’s frequency limitation would prevent multi-frequency measurement be taken. Next we tried the hardware approach by using a 555 timer and low pass filtering the output. This method allows us to realize a 50 kHz sine wave.
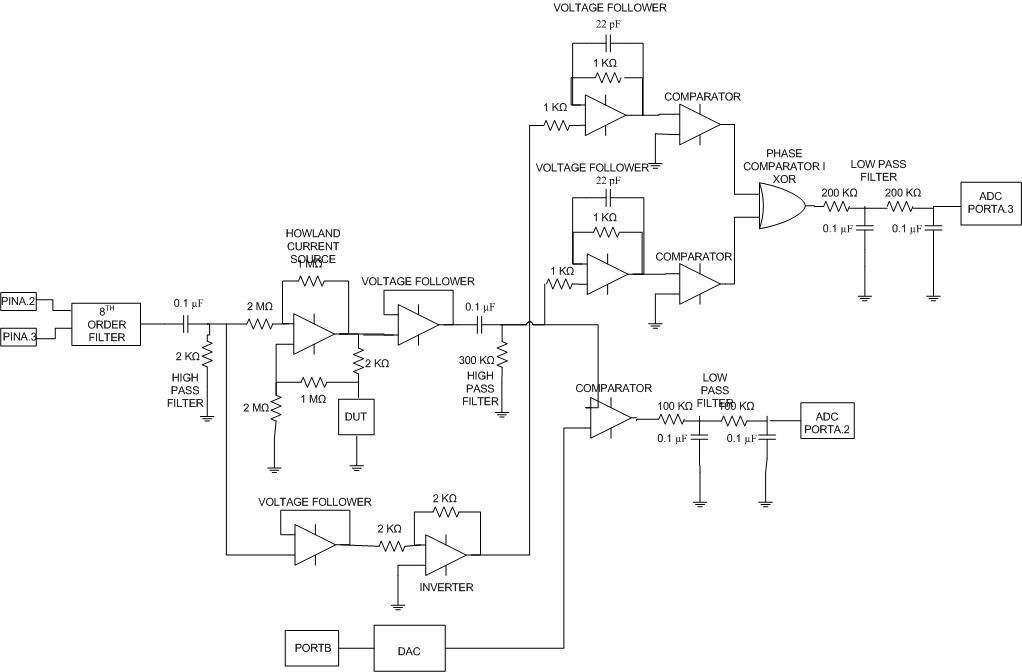
However the need for multi-frequency generation prompted us to combine the software and the hardware approach. We procured an IC butterworth lowpass filter (MAX7480), and toggled the I/O pins on the STK500 to generate clk signal. The clk signals determines the corner frequency on the filter, which filters another clk signal generated by the MCU to give us a programmable sine wave generator. With the corner frequency set at the frequency of the sine wave, this method produced a smooth 50 kHz signal, and requires minimal amount of processing power from the MCU
was not feasible because our current source was not stable enough. Therefore we then decided to change our project to an impedance analyzer for a wide range of frequencies. As a result, we had to change our generator again because hardware timers are normally set at one frequency and must be rewired to generate another. Our final timer design once again uses software, the timer alternates the switching of a pin generating a square wave that is filtered by an 8th order Butterworth filter. This last design does not require much processing time, can generate multiple frequencies depending on the timer pres-scalar and OCR value and provides ample time to complete post processing of the hardware circuits. The most ideal sine wave generator is probably using a waveform generator chip so we could vary the frequency and the voltage amplitude of the waveforms generated.
In the developing a body fat measurer the main considerations with engineering standards are mainly the standards regarding the production of medical devices and testing devices on human subjects. In developing a medical device there are a variety of standards to meet because it will be used on human beings, however in construction of an impedance analyzer there are not that many standards that need to be considered. One such IEEE standard was a resistance measurement standard but it has been withdrawn.
Both the body fat measurer and impedance analyzer are patented devices, however our design is not based upon the existing devices as those designs are not open to the public and would probably cost more than our required budget. Therefore our design for measuring impedance is an innovative design that we came up on our own. The main papers and designs that we referenced were the paper, “A Multi-Frequency Current Source for Bioimpedance Application” by Kuo-Sheng Cheng, Cheng-Yu Chen, Min-Wei Huang and Chien-Hung Chen and documentation by RJL Systems, a pioneer of bioimpedance sciences since 1979. From the RJL Systems’ documentation we gained valuable insight into the basis of bioimpedance measurement and from the “Multi-Frequency Current Source for Bioimpedance” paper we obtained a general design method to create a multi-frequency current source. Aside from these two main sources, we developed our own method of analyzing the output signal based on fundamental ECE principles.
Program Design
The software can be separated into three parts: 1) square wave generation at a known frequency, 2) amplitude and phase shift measurement, and 3) the plotting of the results on the TV.
1) Square Wave generation:
The sine wave generation method we adopted is to low-pass filter a square wave with a corner frequency at the square wave frequency. This method requires two square waves: one to serve as the signal to be filtered into a sine wave, and the other to feed into the clock of the filter (MAX7480) to determine the corner frequency.
The filter works by having a clock signal that has a frequency 100 times of the corner frequency. For instance, an external clock signal of 100kHz would set the filter’s corner frequency at 100Hz. The filter’s corner frequency range is from 1Hz to 2kHz. Thus, the square wave that needs to be used as the clk line has to be 2kHz * 100 = 200kHz at its maximum.
The challenge lies in the use of different timers to generate two high-frequency square waves for the filter. Because the highest frequency that needs to be generated is 200kHz, that means the I/O pin has to toggled at 400kHz. Consequently, ISR has to be evoked every 40 clock cycles to produce a 2kHz sine wave.
It was first attempted to use one hardware timer to generate the clk signal, and place a counter that counts up to 100 to generate the sine wave signal. However, the software counter uses up too many cycles inside the ISR, and at the highest frequency, the ISR cannot meet the deadline, resulting in a degradation in the sine wave signal. As a result, we switched over to a scheme that employs two different hardware timers, each with a single line of command that toggles their respective I/O pin at different frequencies.
This method works well for high-frequency. However because of the wide range of frequency of square wave that needs to be generated (1Hz to 200kHz). The timers need to be controlled carefully by altering the compare match value (OCR) and the prescaler to ensure maximum resolution and that the OCR has enough bits for the required compare value.
To this end, TIMER2 and TIMER1B are used because they have the highest priority over TIMER0, and TIMER1B has enough bits to store a large number in OCR. This allows generation of low-frequency square wave. However TIMER1B and TIMER1A, which is for video generation, have to be alternated to accommodate for the conflict.
2) Amplitude and Phase shift measurement
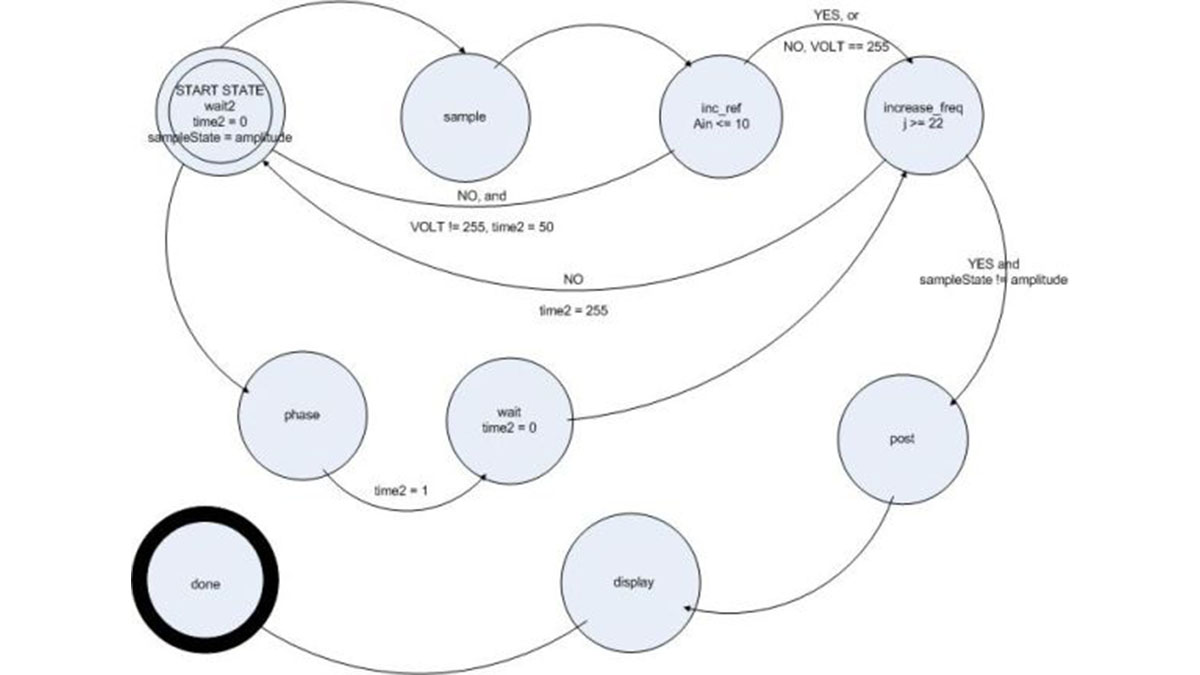
During the measurement phase, a state machine is employed to keep control over the different stages of the measurement. At the same time, TIMER2 and TIMER1B continues to generate square waves, while TIMER0 is evoked every 1 ms in order to provide a timer to provide functions, such as wait and debounce.
The state machine above first selects PORTA.2 to sample the amplitude measurement. In the ref_inc state, the program then examines whether the measurement is close to 0V. If so, that means the reference voltage on PORTB is at or above the peak of the sine wave. The value is then stored in an array, and then the state switches over to increase the sine wave frequency. More details about the measurement is discussed at hardware section.
If the measurement is not close to 0V, the reference voltage output from PORTB is incremented. Then a wait state is introduced in order for the new change in reference voltage to propagate through the circuit. The reason is that the RC low-pass filter averages out the PWM to a DC level, but the averaging will take time to settle to the correct level. After the wait state, the state machine takes another sample, and then jumps back to the inc_ref state to examine the amplitude measurement again. This cycle reiterates until either 1) a peak is determined, or 2) the reference voltage is at max and a peak has not been found. In the latter case, the array will be stored with a value of 0 and an “invalid range” message will be sent back to the PC.
In the increase_freq state, a preset range of frequencies are looped through. At certain frequencies, there may be a need to change the prescalers, and if blocks accomplishes such a task. OCR’s for TIMER1 and TIMER2 are updated with the appropriate values.
After the frequency has been increased, another wait state ensures the sine wave is well established before jumping back to the amplitude sampling state. After all the frequencies are cycled through, phase amplitude is started by jumping to the phase state. ADMUX is written to change the sample pin for the ADC. Then phase measurement is sampled through ADC, and stored in an array. After the phase measurement is taken, we increase the frequency again until all the frequencies have been cycled through and all phase measurements are taken. At this point, amplitude and phase shift measurement are complete.
The challenge of this part is that the waiting time and sample time is crucial in order to achieve the shortest execution time while allowing the circuit to fully reflect the change in the reference voltage. If there is not enough wait time between each voltage increase, the sampled data will not reflect the change, and another increase in the reference voltage could be resulted. As a consequence, the reference voltage overshoots above the peak voltage, and gives a false value.
Parts List:
| Cost Details | |
|---|---|
| Part | Cost |
| STK500 | $15 |
| 12V Power Supply | $5 |
| B/W TV | $5 |
| White Board (2) | $12 |
| STK500 Power Supply | $5 |
| MAX7480 | Sampled |
| MM74HC4046 | Sampled |
| LM833(4) | Sampled |
| LM311(3) | Sampled |
| Total | $42 |
For more detail: Complex impedance analyzer Using Atmega32
- What is the primary function of the developed device?
The device determines the complex impedance of any R-C circuit within a signal frequency range of 500-2000 Hz. - How was the sine wave generated in the final design?
A square wave is low-pass filtered using an 8th order Butterworth filter where the corner frequency is determined by a clock signal from the MCU. - Why was the initial DDS technique on the MCU abandoned?
Generating a 50 kHz sine wave via parallel DAC required excessive processing power, leaving few cycles for amplitude and phase shift measurements. - Which IC is used as the Butterworth lowpass filter?
The MAX7480 IC is used as the Butterworth lowpass filter to produce a smooth sine wave signal. - What are the three main parts of the software program?
The software consists of square wave generation at a known frequency, amplitude and phase shift measurement, and plotting results on the TV. - How does the state machine determine the peak voltage?
The state machine increments a reference voltage until the measurement is close to 0V, indicating the reference voltage has reached or exceeded the sine wave peak. - Which timers are used to generate high-frequency square waves?
TIMER2 and TIMER1B are utilized because they have higher priority than TIMER0 and TIMER1B has enough bits to store large OCR values. - What is the maximum frequency range for the filter's corner frequency?
The filter's corner frequency range is from 1Hz to 2kHz.