Summary of UV Sensor ML8511 AVR Atmega library
The article details a driver implementation for the ML8511 ultraviolet sensor on an AVR Atmega microcontroller. It explains how to convert the sensor's analog voltage output into UV intensity using linear regression derived from datasheet graphs at various temperatures. The system calculates the UV Index, which measures sunburn risk, by applying an erythemal action spectrum weighting curve to the detected radiation.
Parts used in the ML8511 UV Sensor Project:
- ML8511 ultraviolet sensor
- AVR Atmega microcontroller
- WebPlotDigitizer tool
Ultraviolet (UV) is an electromagnetic radiation with a wavelength from 10 nm to 400 nm.
The ML8511 is an ultraviolet sensor that output an analog signal correlated to the amount of UV light detected. By datasheet the sensor detects wavelength from 280nm to 560nm.
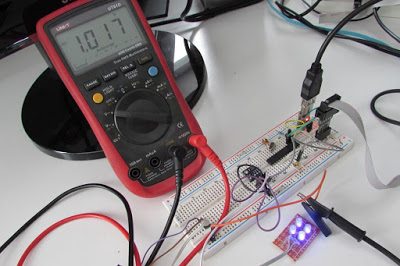
Here I’ve implemented a driver for AVR Atmega, portable to other microcontrollers, that correlates the sensor output to light intensity, it also computes the UV index based on the sensor input.
The ultraviolet index or UV index is an international standard measurement of the strength of sunburn-producing ultraviolet (UV) radiation at a particular place and time. It is a linear scale, with higher values representing a greater risk of sunburn. The purpose of the UV Index is to help people effectively protect themselves from UV radiation.
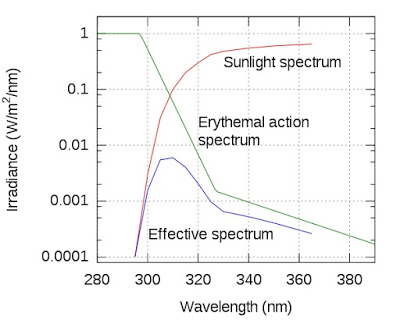
Not all the energy of the UV spectrum has the same “damage” power, due to this the power spectrum is multiplied by a weighting curve known as the erythemal action spectrum, and the result integrated over the whole spectrum.
The correlation function I propose here is derived by the datasheet graph of “Output Voltage over UV intensity“.
From this graph we can get the correlation function. This graph is clearly a linear function. We have Output voltage on the y axis and UV intensity on the x axis.
Because we want to obtain the UV intensity using the voltage that we can read from the sensor, we are going to flip the graph.
Once we have flipped the graph we can now get the point from the graph using a tool like WebPlotDigitizer.
We can now use liner regression technique to obtain the function we need to convert voltage output to UV intensity.
Also notice that this graph has four functions for 75degree, 25degree, -5degree, -25degree temperature condition.
If we perform linear regression on points of that function we get 4 correlation functions.
@75deg UV mW/cm2 = 8.158154634V -7.77772054
@25deg UV mW/cm2 = 7.9816914V-7.921745308
@-5deg UV mW/cm2 = 7.853758854V – 7.934095316
@-25deg UV mW/cm2 = 7.743732684V – 7.978602568
Note thate the accuracy of this method depends on the accuracy of your point extraction.
More in general we can say that the correlation function looks like this:
If we are going to use this sensor under different thermal condition we can simply interpolate beween those function to get the correlation function slope “s” and intercept “i”.
Also, that graph is for a wavelength of 365nm.
We may find the responsivity function of this sensor on the datasheet. Responsivity measures the input–output gain of a detector system. We can use again the WebPlotDigitizer to find points from the “Responsivity Characteristics” curve.
Read more: UV Sensor ML8511 AVR Atmega library
- What is the wavelength range detected by the ML8511 sensor?
The sensor detects wavelengths from 280nm to 560nm. - How is the UV index defined in this context?
It is an international standard measurement of sunburn-producing UV radiation strength using a linear scale where higher values mean greater risk. - Why is the power spectrum multiplied by a weighting curve?
Because not all energy in the UV spectrum has the same damage power, so it is multiplied by the erythemal action spectrum. - How was the correlation function for voltage to UV intensity obtained?
It was derived by flipping the datasheet graph and using liner regression on points extracted via WebPlotDigitizer. - Does temperature affect the correlation function?
Yes, the graph provides four different functions for temperature conditions of 75 degrees, 25 degrees, -5 degrees, and -25 degrees. - Can the sensor be used under different thermal conditions?
Yes, one can interpolate between the existing functions to get the correlation function slope and intercept for other temperatures. - What does the responsivity function measure?
Responsivity measures the input–output gain of the detector system.