Summary of Graphical Weather Station
This article details a DIY graphical weather station featuring accurate sensors for temperature, humidity, air pressure, and CO2. It displays 26 hours of historical data on a 320-pixel TFT screen with trends updated every five minutes. The system includes an optional wireless outside temperature module and an RS232 interface for remote monitoring, utilizing precise components like the HDC1080 and MS5611 to ensure high accuracy compared to standard stations.
Parts used in the Graphical Weather Station:
- TFT Module 2.8 inch without Touch Panel ILI9341 Drive IC
- Microchip 18f26k22 microcontroller 28-PIN PDIP
- HDC1080 module GY-213V-HDC1080 High Accuracy Digital Humidity Sensor
- GY-63 MS5611 High-resolution Atmospheric Height Sensor Module
- MH-Z19 infrared co2 sensor
- NRF24L01+PA+LNA wireless modules (optional)
- 5V To 3.3V DC-DC Step Down Power Supply Buck Module AMS1117
- Ceramic capacitor 100nF
- Acrylic Board 6*12cm or 100*100mm
- Micro USB connector 5pin seat Jack
- Black Universal Android Phone Micro USB EU Plug Travel AC Wall Charger Adapter
- PCB double sided
- M3 nylon spacers/screws
- Microchip 16f886 microcontroller 28-pin PDIP (for outside temp)
- Waterproof DS18b20 temperature probe
- 4k7 resistor
- Prototype PCB breadboard
- 85x58x33mm Waterproof Clear Cover Plastic Electronic Cable Project Box
- Plastic Battery Case Storage Box Holder for 2 X AA
- AA battery
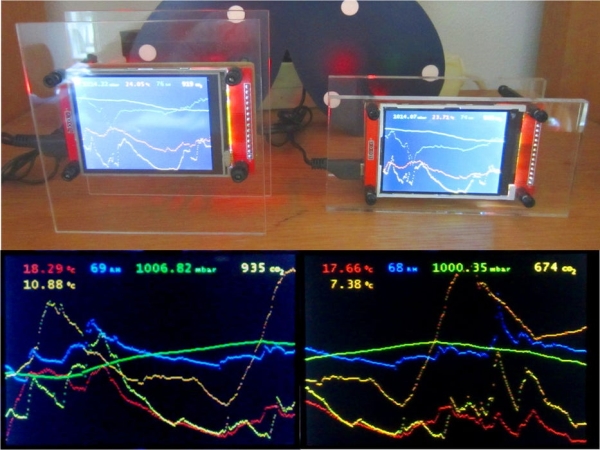
Always wanted to have a graphical weather station? And with accurate sensors? Maybe this project is something for you. With this weather station you can see what the weather is “doing”. Temperatures for example might rise or fall. From a normal thermometer it is not possible to see the temperature history. With this weather station you have an history of 26 hours, displayed over 320 pixels of a TFT display. Every 5 minutes a pixel is added to the graph which will enable you to see if it is having a rising or falling trend. This is done for temperature, humidity, air pressure and CO2 in different colors. Outside temperature is also included wireless. In this way you can “predict” the weather based on what the air pressure is doing.
Normal weather stations do have sensors which are some inaccurate. For example, for temperature they normally have an accurace of +/- 2 degrees. For this weather station more accurate sensors are used. The HDC1080 temperature sensor does have an accuracy of +/- 0.2 degrees which is far better. The same for humidity and air pressure.
At the top of the TFT display the measurements of the sensors are displayed and refreshed every 5 seconds. These measurements are also available via RS232.
Main features:
- Graphs in different colors for recognizing trends
- Accurate sensors for temperature, humidity and air pressure.
- Factory calibration data and sensor temperature are read from sensors where possible and applied to code to get the most accurate measurements.
- Temperatures are available in Celsius (default) or Fahrenheit.
- Outside temperature via wireless module (optional)
- RS232 interface for remote monitoring.
- Nice small design (even my wife tolerates it in our living room 😉
I hope you will enjoy examining the weather conditions the same as I do !
Step 1: Parts
1 x TFT Module 2.8 inch without Touch Panel ILI9341 Drive IC 240(RGB)*320 SPI Interface
1 x Microchip 18f26k22 microcontroller 28-PIN PDIP
1 x HDC1080 module, GY-213V-HDC1080 High Accuracy Digital Humidity Sensor with Temperature Sensor
1 x GY-63 MS5611 High-resolution Atmospheric Height Sensor Module IIC / SPI
1 x MH-Z19 infrared co2 sensor for co2 monitor
1 x (optional) NRF24L01+PA+LNA wireless modules (with antenna)
1 x 5V To 3.3V DC-DC Step Down Power Supply Buck Module AMS1117 800MA
1 x Ceramic capacitor 100nF
2 x Acrylic Board 6*12cm thickness 5mm or 100*100mm thickness 2mm
1 x Micro USB connector 5pin seat Jack Micro usb DIP4 legs Four legs Inserting plate seat mini usb connector
1 x Black Universal Android Phone Micro USB EU Plug Travel AC Wall Charger Adapter For Android Phones
1 x PCB double sided.
Some M3 nylon spacers/screws
–
For outside temperature (optional)
1 x Microchip 16f886 microcontroller 28-pin PDIP
1 x Waterproof DS18b20 temperature probe temperature sensor Stainless steel package -100cm wire
1 x 4k7 resistor
1 x NRF24L01+ Wireless Module
1 x Ceramic capacitor 100nF
1 x Prototype PCB breadboard
1 x 85x58x33mm Waterproof Clear Cover Plastic Electronic Cable Project Box Enclosure Case
1 x Plastic Battery Case Storage Box Holder with Wire Leads for 2 X AA 3.0V 2AA
2 x AA battery
Step 2: PCB
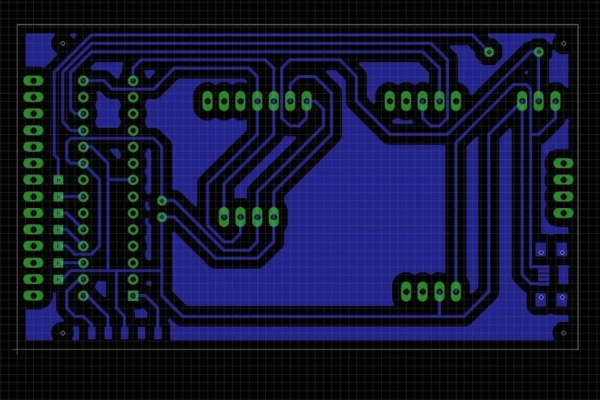
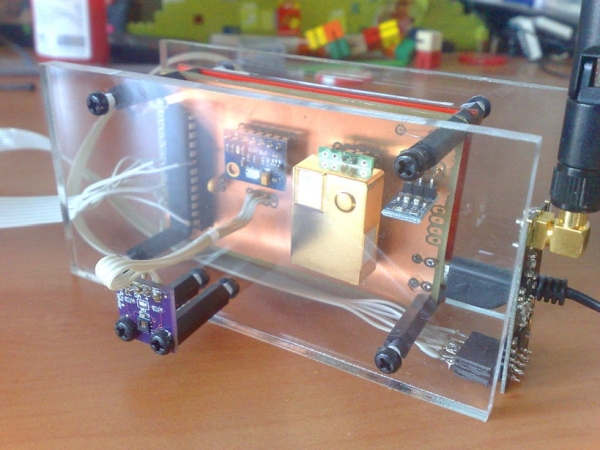
I used a double sided PCB for this project. The Gerber files are available. This PCB fits at the back of the TFT display. The temperature sensor is mounted at the back to prevent heating from the circuit. Connect the NRF24L01+ in the following way to the microcontroller:
pin 2 – CSN of NRF24L01+
pin 8 – GND of NRF24L01+
pin 9 – CE of NRF24L01+
pin 22 – SCK of NRF24L01+
pin 23 – MISO of NRF24L01+
pin 24 – MOSI of NRF24L01+
pin 20 – VCC of NRF24L01+
n.c – IRQ of NRF24L01+
Step 3: Outside Temperature
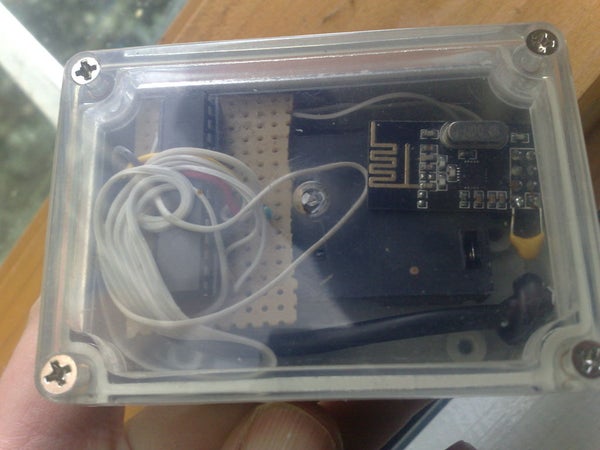
The 16f886 microcontroller is used to read the DS18B20 temperature sensor every 5 minutes. This temperature is transmitted via the NRF24L01+ wireless module. A prototype PCB breadboard is sufficient here. Use the following microcontroller pin configuration:
pin 2 – CSN of NRF24L01+
pin 8 – GND
pin 9 – CE of NRF24L01+
pin 14 – SCK of NRF24L01+
pin 15 – MISO of NRF24L01+
pin 16 – MOSI of NRF24L01+
pin 20 – +3 volt of the AA batteries
pin 21 – IRQ of NRF24L01+
pin 22 – DS18B20 data (use 4k7 resistor as pull up)
Step 4: RS232 Output
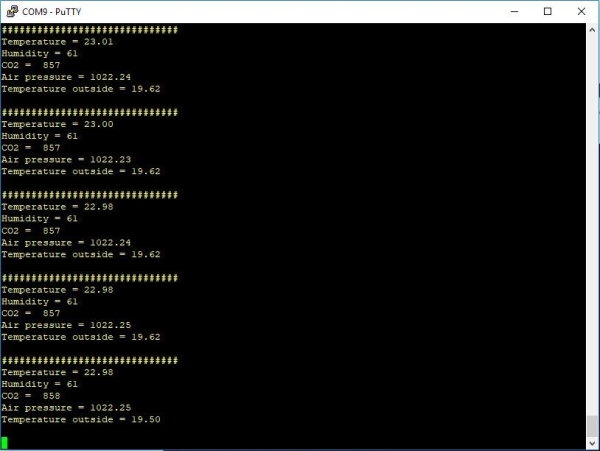
Every 5 seconds the measurements are provided via RS232 at pin 27 (9600 baud). You can connect this interface to your computer and use a terminal program (e.g. Putty) to get the data. It allowes you to use the measurements for other purposes.
Step 5: Code
The sensors used in this project are using different interfaces of the 18f26k22 microcontroller. So is the first serial interface used by the MH-Z19 CO2 sensor. This interface is set to 9600 baud. The second serial interface of this microcontroller is used for providing the sensor measurements at pin 27 every 5 seconds so you can connect it to your computer (also set at 9600 baud). The HDC1080 temperature/humidity sensor and MS5611 air pressure sensor operates on i2c interface. The TFT display and NRF24L01+ wireless module operates on the same SPI interface configured at 8 Mhz. The 18f26k22 microcontroller itself is set to 64 Mhz. By default, the temperatures are in Celsius. By connecting pin 21 to ground you get the temperatures in Fahrenheit. Thanks to Achim Döbler for his µGUI graphic library and Harry W (1and0) for his 64bit solution.
The 16f886 microcontroller is used for measuring the outside temperature. The DS18B20 temperature sensor is read every 5 minutes (one-wire protocol is used here) and transmitted with the SPI interface via the NRF24L01+ wireless module. Most of the time this microcontroller is in low power mode to save batteries. Of course also negative temperatures are supported. If this outside temperature feature is not used it will not appear on the TFT screen so it is optional.
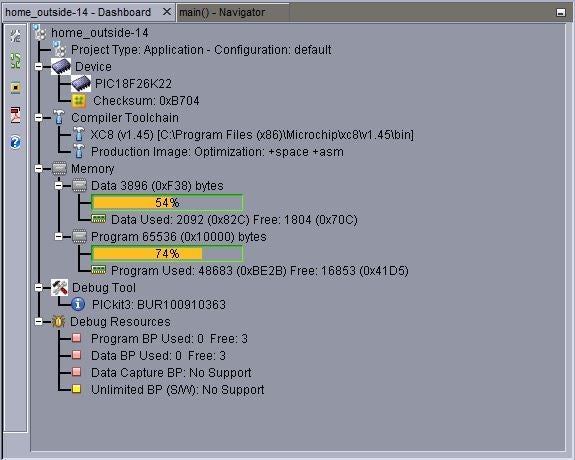
For programming the 18f26k22 and 16f886 microcontrollers you need a pickit3 programmer. You can use the free Microchip IPE programming software (don’t forget to set VDD to 3.0 volt and check the checkbox “Power Target Circuit from Tool” at “ICSP Options” at “Power” menu).
Step 6: Timelaps Impression
A timelaps impression of how about 15 hours of weather monitoring looks like. The white haze on the display is not there in reality.
- In red the inside temperature
- In orange the outside temperature
- In blue the humidity
- In green the air pressure
- In yellow the co2
Step 7: Enjoy
Enjoy this project !!
But on principle, it is quite wrong to try founding a theory
on observable magnitudes alone. In reality the very opposite
happens. It is the theory which decides what we can observe.~ Albert Einstein in Physics and Beyond of Werner Heisenberg p. 63
Source: Graphical Weather Station
- How does this weather station display temperature history?
The station records 26 hours of data, adding one pixel to the graph every 5 minutes across 320 pixels to show rising or falling trends. - What is the accuracy of the temperature sensor used?
The project uses an HDC1080 sensor which provides an accuracy of +/- 0.2 degrees, significantly better than the typical +/- 2 degrees found in normal stations. - Can I view the measurements remotely via a computer?
Yes, measurements are refreshed every 5 seconds and available via an RS232 interface at pin 27 running at 9600 baud. - How do I switch the temperature display from Celsius to Fahrenheit?
By connecting pin 21 to ground on the microcontroller, the default Celsius temperatures will be displayed in Fahrenheit. - Does the system support wireless outside temperature monitoring?
Yes, an optional setup using a 16f886 microcontroller and a DS18B20 sensor transmits outside temperature wirelessly via an NRF24L01+ module. - Which interfaces are used by the different sensors in the code?
The CO2 sensor uses the first serial interface, the temperature/humidity and pressure sensors use i2c, while the TFT and wireless module use the SPI interface. - What tool is required to program the microcontrollers?
A pickit3 programmer is needed to program both the 18f26k22 and 16f886 microcontrollers using free Microchip IPE software. - How often is the outside temperature sensor read?
The 16f886 microcontroller reads the DS18B20 outside temperature sensor every 5 minutes.