Introduction
For our final project, we have designed and built a ‘proof of concept’ prototype for Project Green Stations, an externally funded student group with the following mission statement:
Project Green Stations is all about changing the way people see the environment. Imagine the go-green movement as a brand. Solar panels, Toyota Priuses, and waste receptacles are all points of interaction with your idea of going green.By designing elegant, simple, and technologically advanced waste bins, we improve one element that affects that perception; one element that almost all students, faculty, and staff at Cornell see every day.We plan to have the first full prototype manufactured over the summer and ready to go before August. Over the next academic year, we will be looking to further refine the aesthetics and the hardware to best fit our needs. The expectation is by the beginning of the 2013-2014 academic year, we will begin full scale implementation.
Of course as engineers, we were intrigued by the breadth of the design challenges which were posed by the idea. These include:
- An independent power system capable utilizing solar power to maintain battery charge
- Two different mechanisms for measurement (weight and volume)
- A GSM-based communication system for web and cellular interface, used for data collection and system monitoring
- A beta version of the web interface used to record and display data
We were also interested in developing a project which will be worked with beyond demo day. This presented a much different context for the development of the project compared to how we would otherwise operate. We had to meet with the team typically once a week to discuss the specs of the project and provide status updates. Throughout the process, we had to be more concerned with extra challenges like minimizing cost and making the system easy to further develop.
High Level Design
The Power System
The requisite for solar power comes from the core of the thinking behind this design: a completely sustainable embedded system, which could ultimately monitor our own efforts towards a sustainable society. Given the downward trend in cost/unit energy of solar power, combined with gains in the efficiency of solar cells, it seems that solar could soon be a commercially feasible way to power isolated systems such as these. Our basic implementation is shown here:
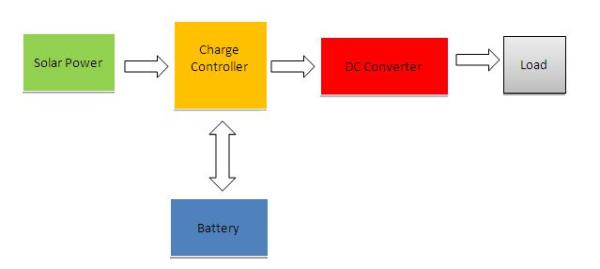
The design of the power system is driven by the solar panels. The incorporation of the charge controller, while complicating the design with some ‘IC tuning’ circuitry, enables higher efficiency power transfer from solar cell to battery, which is a huge gain for this application.
Operating voltages for each system had to be considered. A 6V battery would provide enough ‘buffer voltage’ for the system to operate reliably even through the greyest stretches of Ithaca weather. The charge controller requires that the voltage input from the solar panel be at least 3.3V higher than the voltage of the battery. We decided that a 12V panel would be appropriate, as it is a common operating voltage in the size and wattage appropriate for the system. The rest of the system runs at 5V, only because the minimum operating voltage of the GSM module is 5V. We were hoping to run all digital components at 3.3V with a 5V supply to drive the measurement circuitry, but decided the additional cost and loss in efficiency would not be worth the effort.
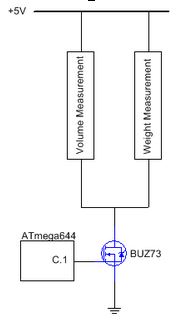
Power to the measurement system is controlled by a low-side switch, implemented with a power MOSFET controlled by the MCU. Because this system can draw up to over 650mA, it’s important to be able to limit operation.
What enables us to drive what can be a very power intensive system at times is the fact that the system will be asleep for the vast majority of the time. Both the GSM and MCU have low power modes, which reduces power consumption to the low milliwatt range. It can be awakened by timers and according to the operating protocol, will perform its various tasks. These will use a higher wattage for a short period of time, after which the system puts itself to sleep again.
Measurement System
Measurement devices that would be applicable to our needs for measuring some quantity (distance sensors for volume, force sensors for weight, etc.) are beyond the price and performance range of the application. As a result, this turned out to be the most improvised subsystem of our final project.
In our search for a cheap alternative to weight sensors, Bruce mentioned an interesting property of the ESD foam around the lab. There�fs a correspondence between a compression force on the foam and it�fs resistance as a semiconductor. We harnessed this effect with a simple voltage divider and trial and error testing, followed by an easy calibration to map what the on-chip ADC reads at the output of the voltage divider to an actual weight.
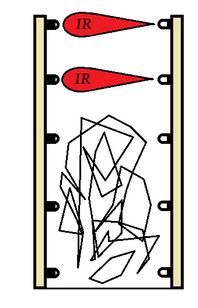
The idea for volume measurements stemmed from our lab 4 project, where the scattering/absorption effect of infrared light were used to determine the RPM of a fan. For this application, an array of IR emitters is oriented vertically within the trash can, opposing an identical array of phototransistors. The sum of the currents drawn through the phototransistors by the presence of IR light is drawn through a resistor, creating a voltage drop that corresponds to the level of the trash within the can. If trash blocks the light, then the total current and thus the voltage drop will decrease. Again, all that is left to do is take a quick ADC measurement from the node of interest, which is fed into a rough line of best fit based on the calibration to estimate the volume of trash in the can.
In addition to being the most improvised, the measurement system was also the easiest to implement. While some testing and calibration was required, the hardware and the physics do most of the work for taking the measurements, which are simple ADC conversions. Additionally, expanding the measurement system to monitor multiple receptacles within the same unit (e.g. trash, recycling, and compost) is a matter of replicating the circuits and the code, which is important for the future intentions of the project group.
Web Interface
The server is responsible for receiving, storing, fetching, and visualizing the data it receives from the trash system.
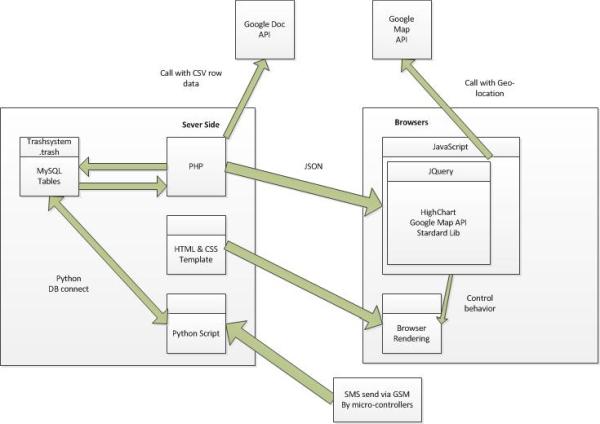
As shown in figure 4, the data is stored in the form of the Tables in MySQL server. The website is hosted on the server side (a laptop) in the form of HTML and JQuery. The JQuery generates the visualization of trash data and bin location using data from the MySQL. Since JQuery runs on client side and can’t access and server side resources, it needs to interact with PHP to fetch data from MySQL.
The received data from microcontroller is in the form of SMS. To convert a SMS message into a SQL query, we use a relatively simple Python Script. The Python Script runs every one or two hours checking the Google Voice Account for an incoming SMS message. It parses the HTML into a tree to fetch the SMS message, translates the sub-tree into dictionaries to extract the fields, performs the database query, and then deletes the SMS message from the inbox.
Some additional outside API are called by the JQuery to perform additional functionalities. The Google Map API is called with Geo-location data to display the location of trash bins on a map. And the Google Doc API is called with CSV data to enable export of data to Google Doc for further modeling and analysis.
Communication
For a communication system, we were granted a Telit CC864-DUAL GSM module, complete with a 6 month data plan from the nice folks at Verizon. The module comes complete with USB and RS232 serial interfaces, a CDMA wireless transceiver, GPS unit, and magnetic antennae for better signal quality. Interfacing with the device turns out to be incredibly easy. Serial commands from the MCU can control power mode and data transmission.
Relationship of the design to available IEEE, ISO, ANSI, DIN, and other standards
FCC: Reusing the Telit FCC ID for the end product may be possible if the antenna is greater than 20cm from the human body when in use and there are no co-located transmitters. The system integrator must assess the final product against the applicable FCC regulations. The Antenna we use satisfies the following FCC requirement of less than 5.12dbi gain in CDMA mode.
For the GSM device itself, the manufacturer states the following:
This device complies with Part 15 of FCC Rules.
Operation is subject to the following two conditions:
(1) This device may not cause harmful interference, and
(2) This device must accept any interference received, including interference that may cause undesired operation.
Existing patents, copyrights, and trademarks relevant to the project
We were not able to find any instances of intellectual property akin to this project.
Hardware Design
Power System
Different circuits were approached in different ways throughout the design process. The circuitry for the charge controller is derived completely from the application notes in its datasheet. The topology and component values simply tune the IC to do what we need it to do.
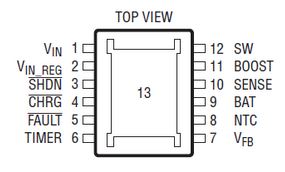
The LT3652 Power tracking battery charger, with a feature set geared for solar charging, comes in an MSOP-12 package, which we had to break out with a specialized protoboard.
The BOOST supply and maximum charge current were configured with the following topology:
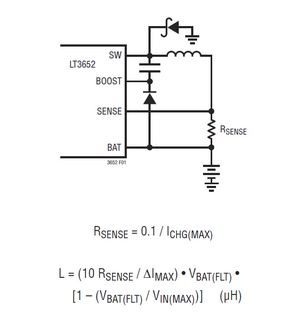
The two components of interest are the inductor and the sense resistor. For our purposes, we want the maximum charge current of 2A, corresponding to RSENSE=0.05Ω. VBAT(FLT) is our battery voltage of 6V. Assuming a ΔIMAX (ripple current) between .25ICHG(MAX) AND .35ICHG(MAX) and a VIN(MAX) from a 12V solar panel of 17V (on a cold clear day), we chose and inductor value of 3.3μH capable of handling the maximum charge current and necessary power transfer to the battery.
We tell the IC what the voltage of the battery is via a resistive voltage divider as follows:
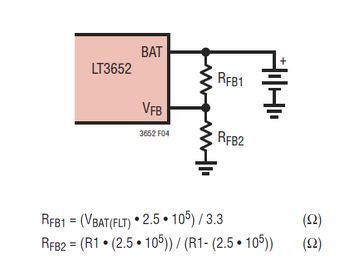
For our application, we have RFB1=454kΩ and RFB2=555kΩ.
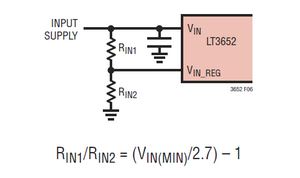
We also set a minimum input voltage from the solar panels before the IC shuts off. Again this is accomplished with a resistive voltage divider:
A single trim resistor is needed to program the output of the DC-DC converter, which has the following topology:
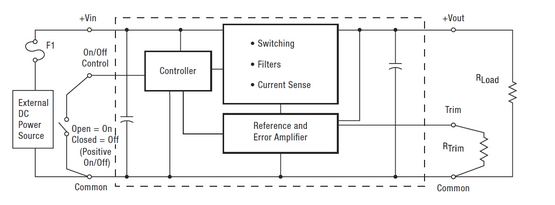
From the datasheet, RTrim must take on a value of 268Ω in order to output our 5V supply.
Measurement System
The measurement circuitry allows for much more creativity in its design.
On the other hand, the measurement system relies on a nifty hack (kudos to Bruce) and some LED/phototransistor biasing to achieve its requirements.
For weight sensing, we use an interesting property of common ESD foam to get weight measurements. The resistance of ESD foam is related to pressure on the foam itself. With increasing pressure, the resistance of the foam decreases. Folds in the foam significantly amplify this effect. The right combination of number of ‘resistors’ in series and the number of folds per resistor produces a repeatable correlation between weight and the output of a voltage divider, with the foam serving as R1. The selection of R2 was determined by sensitivity desired to meet our weight-range, but power dissipation through the circuit had to be kept in mind.
Ultimately, we wound up with four 2″x7″ pieces of foam, each in series and folded twice in each corner of the plywood �esandwich�f upon which the bulk of the trash bag rests. With no weight on the sensor, these resistors have an equivalent resistance of 25kΩ. This serves as the R1 our circuit. As compression increases, the equivalent resistance of the sensor drops to as low as 10kΩ. With an R2 of 20kΩ, we have a swing from 2.2 (no weight) to 3.3V (max weight) to interpret as a weight with the following calibration:
The volume measuring circuit is a simple LED/phototransistor setup. There are five high-power IR emitter diodes connected in parallel from VCC = 5 V to GND. Correspondingly, there are five phototransistors (one for each diode) connected in a similar manner. There’s one LED/phototransistor pairing at the 20%, 40%, 60%, 80%, and 100% ‘fill lines’ of the can. If each diode is emitting the same amount of IR energy and each phototransistor is biased identically, then we can generate a reliable approximation of the volume of trash based on these 5 sample points. The LEDs will be on when there is no interference in the path between the two (i.e. trash hasn’t reached that level yet). The transistor will be off when there is such interference, drawing less current through the resistor and producing a higher output voltage to be read.
Each diode has a current limiting resistor, selected to bias current through the diode at 100mA. This current value was determined after a rough analysis of radiated power needed from 2′ (approximate width of the trash can) for the phototransistor transduce an appropriate amount of current from an appreciable level of irradiance.
From the datasheet for the VSLY5850 emitter, the forward voltage at 100mA of current is 1.65V. The resistor value could then be calculated as follows:
Erroring on the side of caution, R was bumped down to 25 to ensure a strong signal for the phototransistors. The emitters have a radiant intensity of 600mW/steradian at 100mA. We can convert this to irradiance as follows:
From the BPW77NB IR phototransistor datasheet:
These numbers serve only as a rough estimation on whether or not these components could work. It assumes perfect alignment between emitter and phototransistor, which is not feasible given our mechanical limitations. It also doesn’t take into account the fact that these LEDs will be operating through a clear or translucent garbage bag. For our test setup the distance between emitter and phototransistor is closer to 1′, so 120Ω was appropriate to see all five of the fill levels when read with the ADC.
Software Design
MCU Software
Software on the MCU was designed to be as minimalistic as possible. The Tiny Real Time kernel was used to make the timed rescheduling of the primary process an easy implementation. The operating protocol of the system has a potential for fine tuning to optimize efficiency of the system, but we felt that a good place to start was to simply run the main process every 30 minutes.
With each run of the main process, volume and weight measurements are taken. If the readings suggest a noticeable change in the trash contained within the system (accumulation or emptying of the trash can), a flag is raised to tell the MCU to update the server with the new data. Additionally, status pins on the charge controller which indicate charging and fault conditions (temperature, bad battery faults) are connected to external interrupts on the MCU. Should a charging cycle initiate or terminate, or a fault condition arise, the MCU reschedules the main process and raises the update flag to notify the server side.
The GSM/GPRS unit is controlled via AT commands through the RS232 serial port. Unless there is a new data from the measurement system or a system alert, the GSM resides in a low power mode. It is automatically awoken from the power saving mode as soon as the MCU initiates any new data transfer. First, the MCU puts the GSM into text mode. Then it requests the unit to send a SMS along with the destination number and the body. When the transmission is complete, the GSM is placed back to power saving mode until the next transmission.
Server Software
MySQL Server
The MySQL system consists of two tables and all tables fall under a single entity of trashsystem.
The first table is a called “name” (trashsystem.name) which has two fields of ID and geolocation. The ID is the primary key here which uniquely identifies a single trash bin; the geolocation is the set of longitude and latitude coordinate that locates the trash bin on the GPS system.
The second table is called “trash” (trashsystem.trash) which has the fields id, time, location, volume, weight, and battery.
| Field | Type | Usage | Primary Key |
| id | Numeric | Uniquely identifies a single trash bin | Yes |
| time | Date | Time Stamp of when the data is collected | No |
| location | String | Location of the trash bin in readable words (Ex: Duffield) | No |
| volume | Numeric | Volume Collected in Compost Bin | No |
| weight | Numeric | Weight Collected in Landfill Bin | No |
| battery | Numeric | Battery Level | No |
Table 1: Field definitions for trashsystem.trash
If we execute a query with “ordered by” dates, we can get a snapshot of all the individual bins at a specific time.
PHP
Though the JQuery/Javascript can lower the site’s response time and shift the computation burden away from server by generating visualization on the client side, it can’t query data from MySQL on the server side. So we need to use PHP to fetch the data.
The PHP is responsible for submitting Query and converting the data in a suitable form to be passed to JQuery on the Client Side to further computation and visualization.
In the index.php, the PHP script first connects to the local database with a set of preset username and password. As a result, the user accessing the file can see the username, password, and the database structure of the server. To protect the security of the server, it is essential that this file to be denied access from the user by adding restriction in .htaccess file. We need to protect all the PHP files in .htaccess like this:
Files ~ �g\.(inc|sql|php)$�h>
order allow, deny
deny from all
/Files
After the MySQL database returns the query to PHP, the script will then organize the data into rows by id. The script will fetch through all the rows returned by the MySQL and convert them into a two dimensional array to be passed to JSON. Then the JSON is read by the JQuery on the client side for further processing.
HTML
Most of the site is developed in compliance with the HTML5. The entire site will also have no problem interacting with HTML 4.1 of browsers. The function that is not available on the HTML4.1 browser is geo-location. We were able to get the user-agent’s location to display on the Google Map, but not for old browser that doesn’t support this feature. In that case, we may seek to use other ways to get the geo-location such as IP-addresses.
The two HTML file for the site, “index.html” and “form.html” are for the main page and Google Doc Export functions. The index.html calls JQuery to display a selection of three visualizations based on the user’s selection on the pull-down menu. A Map that displays the current locations of all the bins is shown at the bottom.
The file “index.html” links to “form.html” for exporting all the data to Google Doc. It has a link back to the index.html. For more information on the Google Doc API, please refer to Next Sections
JQuery/Javascript
The JQuery plays an important role in manipulating and visualizing data. It is used to display charts, maps, and export documents.
The JQuery fetches data from PHP script mentioned earlier via JSON. When a page has been loaded, JQuery waits until the document has been completely loaded and all the data are available on the JSON as row format. Then it proceeds to compute and render the plot on the client’s computer based on the selection in the pulldown menu.
Based on the specific graph, JQuery will go through the dataset and take the specific datasets using auto-ranging. For instance, for today’s trash collection status, JQuery will scan through all rows and chooses all the datasets from today. For historical data, autoranging automatically picks the appropriate data sets depending on different amount of data on different dates. On days where a large amount of data is collected (many updates from MCU), the script will pick only the representative data sets to avoid overcrowding the graph with too many data points. On days with very little data (or multiple days of missing data), the script will attempt to interpolate data to facilitate understanding of the graph trend.
Then JQuery computes additional data based on the specific graph: For example, it needs to sum up the collection per date to be charted as a pie chart. It may also compute the moving average to be trackable on the graph in order to see the trend.
The last step involves rendering different charts. JQuery will call the respective chart library with specific properties (color/units/cursor pop-up) to be plotted.
Google Doc API
The Google Doc API is called by the JQuery in exporting dataset to Google Doc. In this case, a HTML page “form.html” will display a page instructing a user to enter his/her Google Account Username/Password/Doc Name in a form format to be exported. The submitted form information is passed as argument to a PHP script, which in turn fetches the data from MySQL, which is in turns makes functions calls to Google API.
The first Google API call takes in username and password and initiates a login action. Then a set of function calls is made to find the corresponding column with the field “id”, “location”, “volume”, “weight”, “battery” and the data is inserted into the first empty cell right below those fields. The purpose of this is to avoid overwriting any existing data, and the user is free to place the field anywhere on the Doc and have the script insert data right below. The default instruction tells the user to create a field in the first row and let the script insert the data below.
After the columns are located, one API call is issued per row data to insert data until all the data are inserted. If there is any problem in API call due to network, PHP or other problem, the system is told to halt the operation and asks the user to try again. Those problems are beyond our control and may occur, but very rarely.
Google Map API
The JQuery makes its use of Google Map API in rendering the Map at the bottom of homepage. The default set up renders the Map on a 800X900 Canvas with two geo-location of the trash can. The geo-location coordinates on converted to Longitude and Latitude before calling the API to locate the markers on the map.
Python Script
The Python Script is scheduled to run every hour to check for any pending SMS message from the trash systems. The SMS sent from the microcontroller needs to follow a certain format as follows:
trash:0:Duffield:10:33:27
| Specific Field of the Message | Trash | 0 | Duffield | 10 | 33 | 27 |
| Purpose | Header | trash system�fs unique ID | String, human readable description of the location | Current Volume in Trash Bin | Current Weight in Trash Bin | Current Battery Level |
Table 2: The fields and their meanings
Note there is no time field in the SMS as the timestamp when the SMS is received will be used as the time.
The Python script will first login to the Google Voice account by sending a HTTP Post message and then received a HTML response from the server. The script will then use the “BeautifulSoup” library to scan through all the HTML tags and pick out all the SMS tags(so we ignore all the incoming call, missing call logs). Then it will parse through each individual HTML item and convert them into dictionaries.
There are many fields in the converted dictionaries format, but the only we are using are “from” (the phone number send the text), “text” (specific text of message), “time” (timestamp of the message being sent) and “id” (note it is different from the id we mentioned earlier to identify each trash bin, this is the unique carrier id that uniquely identifies the message). We can scan through the all the SMS and only choose the specific sender number that are trash system�fs (matching “from”). Then we read out the message content and id. Upon reading out the message content, we parse the text string using delimiter “:” into blocks as shown in Table 2. We then establishing a DB connect to the MySQL, querying an insert statement with the field with the content of SMS and the time.
In addition, there is some data conversion we need to do before attaching them to an insert statement. The date needs to be converted into 24 hour format from the 12 hour format as the default data format used by cellular network are different from the default from the database( Ex: 3:20pm -> 15:20). All the volume, id needs to be casted into numerical form string so the database can process them.
Lastly, after a success insert query with MySQL, the script will use the unique cellular “id” to delete the SMS message from the server to avoid redundant fetching. The script logs off afterward and wait to check again in the next scheduled run time.
Potential Security Issues
The data checking by the Python Script to make sure that the sender phone number is from trash bin may not be enough. An attacker can potentially spoof the number from trash system with fake data. This will result in database take in wrong data thinking it is receiving data from the trash system.
One potential solution is to encrypt the data and decrypt it on the server. But due to the low processing power of micro-controller, an attacker can still decrypt the data using brute force.
Real Time Data Feed
One additional server implements is real time data feed. Real time data time allows the user see real time update on Volume/Weight/Battery without refresh the browser. The script is set up as individual Javascript thread that requests the data from PHP script every 5 seconds. The corresponding deadline is set to 10 secs. Each “thread” requests data from different PHP scripts, which in turns pull the most updated data from the database. Because the strict requirement of deadline to fetch/render/animate, two thread place some stress on the browser and some mobile browser may experience delays.
Concise Instructions To Setup Server Side on any computer
This is quick instruction to set up the server code if you know what you are doing
- Download and Install MySQL
- Configure MySQL
- Set up Root and User Account
- Create new Domain “trashsytem”
- Create a new table under the new domain “trash” using SQL CREATE
- Make sure new table has id(int/primary key), location(char[]), vol(int), weight(int), battery(int),
- Create another new table “name” with id(primary key/id), long(int), lang(int)
- Download PHP and Apache Server
- Install Apache
- Copy PHP you downloaded to C:\php
- Configure httpd.conf to install PHP with Apache, in Apache httpd.conf
- Set “DocumentRoot” to the web directory where all the server files are
- Uncomment line or add the line “LoadModule php5_module “c:/php/php5apache2_2.dll”
- Uncomment line or add the line “AddType application/x-httpd-php .php”
- Set “Directory Root” to the same web directory before
- Change “Allowoveride” to “All”
- Set “PHPiniDir” to point to the PHP directory we copied earlier
- Restart the Apache Service to start running PHP
- Set up access control
- Use Apache’s htpasswd utility to create your password file with different login username and password
- Move your password file to directory under C:\User\(Your login name) or any place no one else have read access
- Edit .htaccess to have “AuthUserFile” to point to the password file you moved
- Add any file you want to restrict in web directory on httpd.conf for security purpose
- Set up Python to run fetching script
- Download and install Python 2.X
- Install easy_install package
- Use easy_install to install BeautifulSoup, or just copy the .egg files directly to directory
- Download and extract pygoogevoice package
- Change the sys.path.append(*) line in the script to point to the pygooglevoice and BeautifulSoup directory
- Change parameter for polling interval in the script
- For all the *.php, *.py files, replace the username and password for the ones you set
Design and Software References
We use some of the OpenSource Library and Code in our project design.
For Software, we use the Apache, MySQL, which are open source.
For the language PHP, Python, Perl, JQuery are all publicly available open languages. We also uses the HighChart Lib for the JQuery language.
For code, we used part of the sample code for Google Map API documentation in drawing the pointers on the graph. We also used part of the sample from Python voice beautiful soup documentation in converting HTML tag into dictionary to extract out the fields for messages.
As far as hardware, circuits were taken from the charge controller datasheet as well as the buck converter datasheet.
Things you tried which did not work
Initially we had ordered a Siemens MC46 GSM unit on the cheap from eBay. However, the part was not nearly as �ehobbyist friendly�f as we had hoped. While attempting to solder insulated wire wrap to the impossibly small Gold pads, several of them were lifted and we were forced to find another alternative.
Initially we thought it would be possible to use a high power emitter circuit at the bottom of the can, which would shoot up to some phototransistors in a circuit under the top of the can. This could provide a single analog output which would provide more accurate measurements for volume. As I started to toy around with the phototransistors and LEDs, I believe that would be a more intensive idea to implement than necessary, so we stuck with the system described above.
MCU Software
Software on the MCU was designed to be as minimalistic as possible. The Tiny Real Time kernel was used to make the timed rescheduling of the primary process an easy implementation. The operating protocol of the system has a potential for fine tuning to optimize efficiency of the system, but we felt that a good place to start was to simply run the main process every 30 minutes.With each run of the main process, volume and weight measurements are taken. These are simply ADC reads which are fed in a calibrated piece-wise defined function for converting to volume and weight. I can safely attribute the non-linearity of the volume measurement system to imperfect alignment between each LED/phototransistor pairing, which can be fixed when a more professional mechanical build. The weight measurement system is very linear, but within a pretty well defined range. This range can be altered as needed to satisfy various weight ranges, and for us we defined our range to be from 0 to 12 lbs.The GSM/GPRS unit is controlled via AT commands through the RS232 serial port. Unless there is a new data from the measurement system or a system alert, the GSM resides in a low power mode. It is automatically awoken from the power saving mode as soon as the MCU initiates any new data transfer. First, the MCU puts the GSM into text mode. Then it requests the unit to send a SMS along with the destination number and the body. When the transmission is complete, the GSM is placed back to power saving mode until the next transmission.
Accuracy
The measurement system achieves an appropriate accuracy for the task at hand. This was done through calibration testing, simply filling the volume or going through the weight range and recording the ADC output. From this, we constructed a piece-wise defined function which is used to calculated volume and weight respective. Volume is measured in terms of percentage of the can filled, so calculating true volume is the same for any sized can. Weight is measure in pounds, with a range from 0 ? 15 lbs possible outputs. Volume is accurate to +/- 10% and weight within +/- 2lbs.
Results
Overall we are pretty satisfied with what we have accomplished. This project posed a wide array of design challenges which we were able to successfully integrate at the end.
The measurement system is able to provide reasonably accurate values for data collection and ‘trash can is full’ notification. It is a safe design for prototyping purposes. The SLA battery does not pose a threat to the environment, and is fused to prevent any damage to the system or those working on the system in the event of a short (which happened a few times to us). The IR LEDs are not powerful enough to cause damage to anyone who happens to stick their head in the trash can.
Speed of execution
The effort to improve the execution time and reduce delay was made in the early design for the server. As user can experience delay while waiting for data to be computed and plotted on the server. We chose run computation and visualization on the server side.
We chose not to implement complex synchronization when the data is updated while being displayed (read) at the same time. So the user needs to refresh the page to obtain the latest plot from the server.
In terms of threading, the receive-and-update Python script runs independently from the read PHP script. Since there is one instance of Python process, there is no race condition to write to the database at the same time. Even if we have multiple processes in the future, we can easily resolve the issue by placing a simple Semaphore Lock around the Database write so only one instance of the process is writing at one time.
Though the JQuery reduces the user delay, there can still be some server delay when server performs the query and encodes the result into JSON. As a result, the user may not see the data available on chart after the HTML text is loaded while server is still querying the data on some of the more complex plots such as “Today�fs Data” and “Historical Data”. One trick/hack to hide the latency is by defaulting the pull-down chart to �gSystem Status�h since it is the simplest plot and the user experiences little/none delay when viewing this plot. When user switches to other more complex plots, the JQuery script has already pre-fetched all the data in 50ms to display them in smooth rendering.
Interference with other devices (e.g. cpu noise, RF interference)
For the MCU, our system operates in low power state most of the time to conserve power as a self-sustainable station. Even in high power, the MCU releases little or none CPU noise to its surrounding. In addition, the metal case will shield away any remaining noise which can potentially leak into the environment.
For our infrared sensor, they operate in reasonably low power and the case shield away most of the infrared will not cause any interference to other electronic device.
For our wireless GSM module, the manufactured states:
This device complies with Part 15 of FCC Rules.
Operation is subject to the following two conditions:
(1) This device may not cause harmful interference, and
(2) This device must accept any interference received, including interference that may cause undesired operation.
Usability
No one should have any issues throwing trash in our bin/using web interface. Our design went into more research into this topic. They studied average human height to mak sure it is easy to throw trash into it. They also adjusted height to prevent animal from accidently get trapped inside.
Conclusion
How the results met our expectations
One aspect of the design we wished to change is to get a better serial IC (Class A) for faster baud rate on the serial port. For the current Class Serial IC, it can only achieves a maximum baud rate at around 10K. In order to talk to the GSM using the default baud rate of 115200 Baud, both sides needs to scale down to 9600. The setting to downclock the baud rate on the GSM has to be on the computer and saved to the memory setting. However, when the device is being reset, the GSM changes its baud back to the default 115200 and requires another calibration on the PC to match the baud rate again with the MCU. If we can design the system with a faster serial chip, we can eliminate another inconvenience from our design.
If we had more time to develop, we would refine the power system and operating protocol for maximum efficiency. This would include a separate 3.3V rail for digital components, and the use of a much lower power oscillator for the design.
Our design fully meets the applicable standards mentioned at the end of ‘High Level Design’.
As far as intellectual property goes, we are not aware of any previous protected designs with a similar function to this device. As far as looking into protecting the design for ourselves, it remains to be determined, pending feedback from those who have experience with such matters. The same goes for the publication on the open web.
Did you use code in the public domain?
Code from the public domain was utilized, specified at the end of the program/software design section.
Did you have to sign non-disclosure to get a sample part?
Nope
Are there patent opportunites for your project?
Yes
Are there publishing opportunities for your project?
Yes
Ethical considerations. Refering to the IEEE Code of Ethics, specifically explain how decisions you made or actions you took in this project were consistent with this Code of Ethics. I expect at least 200 words on this topic. A bulleted list will not be acceptable. Ethical Considerations
During the design and testing of our project we complied with the IEEE code of ethics. As this isn�ft really a device that interfaces directly with the users, doing so was not so much of an issue.
Perhaps the biggest concern would be the SLA 12V 12Ah battery, which is capable of delivering a ton of energy in a very short amount of time should a short circuit occur. For this reason we fused the battery and designed the system to be completely safe to the surrounding environment should the fuse blow (at 4A). We also soldered every connection to on the system, to further decrease the likelihood of a short.
Another consideration was the IR light used, which is capable of causing damage to the retinas of the human eye with high power, direct, close range exposure. The IR LEDs we used are not capable of such damage, and their location within the trash can would make it most difficult to even attempt such a stunt.
The RF communication used by the system conforms to all FCC standards, so interference with nearby electronic devices is no different than that given off by a cell phone.
Our project is free of any conflicts of interest, and we have not/will not receive any incentives for our work. The results of the design have been presented in as transparent a manner as possible. There are no undertones of discrimination against any person for any reason, and no people nor animals were harmed during the making of the design.
Legal considerations
The only applicable legal considerations have been described above, and we feel that we�fve done our best to meet each and every one of them.