Introduction
The Music Wand is a device that optically reads printed sheet music in real-time and synthesizes the notes which are read from the page.
The device uses a linear image sensor mounted on the end of a handheld wand to scan printed sheet music and identify the note pitches. For each note detected, a synthesized piano note is played at the detected pitch. We chose this project in order to explore image processing and sound synthesis on the microcontroller in a creative and practical context. The concept of a music-reading wand appealed to us because it would allow a novice musician to easily learn sheet music without the help of a musical instrument.
The Music Wand was developed and built as a design project for ECE 4760 in the Cornell University School of Electrical and Computer Engineering.
High-Level Design
Due to the performance limitations of the microcontroller, sophisticated image processing on the microcontroller is very difficult and thus is not often attempted. In order to get around some of the problems of image processing, we chose the well-defined application of reading music. This allowed us to significantly decrease the amount of computation required by the microcontroller by taking advantage of the nature of musical notation. The key to the success of our project was the structure of the musical staff, where the five parallel staff lines gave us a basis for orientation and note recognition. In addition to the image processing algorithm, we designed a user interface from the PC to the MCU via serial port (using Windows Hyperterminal) with which the user selects the clef and key signature of the music to be scanned. During scanning, the notes detected by the image algorithm are played using an enhanced version of the Direct Digital Synthesis (DDS) scheme presented to us earlier in the year.
Background Math
Direct Digital Synthesis (DDS)
Direct Digital Synthesis is implemented similar to the method used in lab 2, with some modifications. The basic operation is the same. We still use the fast PWM mode on the Mega32’s timer 0, an accumulator table, a 256 entry sine table, and an increment for the accumulator based on the desired frequency. To improve accuracy, we use a 32 bit accumulator and a 32 bit increment. Since the sine table has 256 entries, we only use the upper 8 bits as a lookup index into the sine table, which holds 8 bit chars. Once again, the maximum frequency we could generate was about 3.9KHz with 16 samples per wave. Instead of using the internal DAC through OC0, we decided to create an external DAC for accuracy (see Hardware Design).
|————————————————32 bits———————————————————–|
| 8 bits for sine table | 24 bits to increase resolution |
Sample Accumulator Table. The increment is added to this table at each cycle of the PWM.
Notice that only the top 8 bits are used to retrieve a value from the sine table. As we will see in the following calculations, the resolution of the DDS is set by the number of bits in the accumulator, thus we used 32 bits instead of just the minimum of 8.
The required increment for each frequency was calculated using the following formulas:
(1) Fs=clk/N
This formula relates the sampling frequency of the sine wave Fs to the clock speed on the mega32. In fast PWM mode, N=256, giving Fs=16MHz/256=62.5KHz. This means that we can sample the sine wave at a maximum rate of 62.5KHz.
(2) Resolution=Fs/2x
This formula relates the sampling frequency to the best resolution we can get in frequency, with x being the number of bits in the accumulator. Basically we are trying to find out how much the frequency changes when we change the increment by 1, or equivalently the frequency of the wave when the increment is 1. We can produce 1 sine cycle per accumulator overflow, thus with an increment of 1 and a 32 bit accumulator we can produce 1 sine cycle every 216 increments. With the increment frequency given by Fs, this gives 62.5KHz / 216 =1.46e-5Hz resolution.
(3) inc=fsine/resolution=fsine*6.87194767e4
This formula describes the increment needed to produce a given sine wave frequency fsine. If each we raise the increment by 1, we get a 1.46e-5Hz change in frequency as given by the resolution formula. This means that for a given increment inc, fsine = inc*resolution. Thus, solving for inc we find inc=fsine/resolution.
We calculated the required increment for each sine wave frequency ourselves using a calculator and formula (3), and then stored the increments in a table to be looked up when a given frequency was needed. The frequencies playable by our project and their corresponding notes can be found in the Appendix.
In order to make the sound produced sound more like a musical instrument (such as a piano) and less like a simple sine wave, we added a few features to the DDS code. In order to perform these modifications, we used and adapted the code from Guitar Demigod: Guitar Synthesizer and Game, by Adam Hart, Morgan Jones, and Donna Wu from spring 2006. The first step is to add some harmonics, because real instruments have several harmonics in addition to the fundamental frequency. The harmonics added were the 2nd through 4th harmonic, which creates a sound reasonably similar to a piano. The harmonics have less amplitude as they get higher in frequency also. To easily add these harmonics, rather than synthesizing four notes and summing them, they are added at initialization when the sine table is created. Instead of being created with just one frequency, the harmonics are multiplied and added in.
The second major component of the sound of a musical instrument is the shape of the amplitude envelope. The simplest approximation to a plucked or struck string is the attack, decay, sustain, release model. In this model, when the string is struck, the amplitude envelope rises quickly to a maximum(attack), decays quickly to a lower value(decay), very slowly decreases as the note is held (sustain), and then quickly drops to zero to end the note(release). This approximation is very similar to sound produced when a piano note is struck. To implement this model, before the sine table entry is output it is scaled by an envelope scaler variable Envelope_Accumulator, which represents an 16 bit fraction with the radix point to the left of the MSB. The multiplication is performed in 8:16 fixed point using assembly code. The assembly written in by Hart, Jones, and Wu was unnecessarily complicated for the accuracy required, so we rewrote it part completely. Since we only output 8 nonfractional bits, we only need to multiply the 8 bit sine table entry by the upper 8 bits of Envelope_Accumulator and keep the upper 8 bits of the result (the non-fractional part). This is output to the DAC, and then to the speakers. Envelope_Accumulator is modified by a state machine. The state machine has states for attack, decay, sustain, and release. A target value and an increment or decrement for Envelope_Accumulator is set for each state. The machine stays in each state, incrementing or decrementing the Envelope_Accumulator until the target for that state is reached, at which point it moves to the next state. Increments and decrements can be in the lower 8 bits of the accumulator, which is why the accumulator has 16 bits instead of just the 8 that are used in the multiplication with the sine table entry. This way, the shape of the envelope is easily controlled simply by changing the targets or increments.
Image Processing
The Music Wand uses the Mega32 analog-to-digital converter (ADC) to convert the analog pixel outputs from the image sensor to digital values between 0 (black) and 255 (white). The raw data is then processed using a series of algorithms, described in the “Software Design” section below. The mathematics of these algorithms is very closely tied to the logical structure of the image processing, and so both the mathematics and the logical structure are described below.
Logical Structure
The high-level logical structure of the device is shown below:

To summarize the block diagram: The Mega32 connects with the PC Hyperterminal interface at initialization, and the user inputs the desired clef and key signature. Then, the Mega32 begins reading and processing data from the handheld scanner through the Mega32 ADC (Port A.0), while the image sensor is controlled by interrupt-driven timing pulses from the Mega32 (from Ports C.7 and D.5). When the image processing algorithm and note recognition state machines running on the Mega32 determine that a note should be played, the DDS algorithm runs to ouptput a signal to the external digital-to-analog converter (DAC) attached to Port B. The output of the DAC is lowpass filtered to eliminate high-frequency buzz, then sent through a standard headphone jack to a set of computer speakers. The details of these steps are described in later sections.
Hardware / Software Tradeoffs
Even though we were limited by the performance of the microprocessor, we decided to use an image sensor with unprocessed output combined with more sophisticated processing algorithms to minimize cost. Furthermore, we were constrained by our lack of knowledge of optics and our inability to have precise positioning of the sensor. We were thus unable to take full advantage of the high sensor resolution. A third tradeoff was the use of backlighting to illuminate the area under the scanner (instead of projected light, as in an optical mouse). The combined effect of these constraints was that the image processed by the microcontroller was usable, but not optimal.
Compliance with Standards
Since the image sensor operats by a unique communications scheme, and we did not use any radio communication, there are not many standards applicable to our project. The only relevant standards are the RS-232 serial communication standard used to communicate with hyperterminal on the PC and the ANSI C standards.
Hardware Design
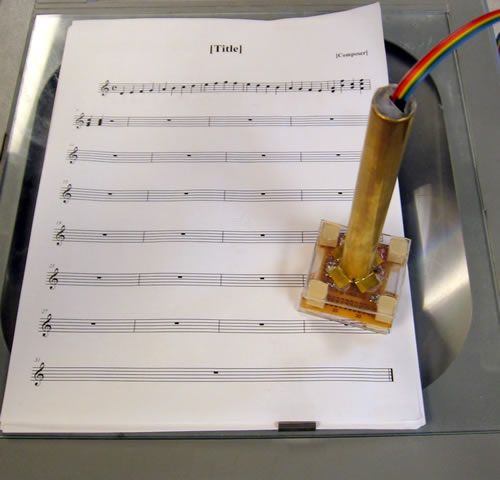
Scanning Wand
The design of the handheld scanning wand is simple, and serves only to provide a stable platform for moving the image sensor across the page. A six-inch piece of 5/8 inch diameter brass tubing serves as a handle, with a plastic cap sealing the tube on the upper end. On the lower end of the handle, the tube is slotted on its four cardinal points and splayed out to form “feet”, which are attached to a 2″ x 2″ square of 1/8″ clear plexiglass using hot glue. On the other side of the plexiglass are four small wooden spacer blocks roughly 3/8″ thick in each of the four corners, similarly attached using hot glue. A DIP solderboard is hot-glued to the bottom of these. The DIP solderboard, cut to a 2″ x 2″ square, contains the wired image sensor circuit (schematic available in the Appendix). The DIP socket and image sensor are placed on the bottom side of the DIP solderboard, facing downward. Attached to the bottom of the solderboard are four more wooden spacers, to which a second 2″ x 2″ sheet of plexiglass is attached to protect the image sensor. These blocks are measured so that the bottom surface of the plexiglass is roughly level with the active surface of the image sensor, which sits in a cutout cut in the bottom plexiglass sheet.
During testing, it became clear that unwanted light was being projected onto the image sensor through the sides of the apparatus. To prevent this from happening, we wrapped a single turn of very narrow electrical tape around the lip of the active surface of the image sensor. This shields the sensor from all light except light coming directly through the page.
The plastic cap at the top of the brass tube as well as the top sheet of plexiglass at the bottom of the glass tube have small cutouts to allow wires to run from the solderboard to the STK500 via a ribbon cable. We placed a power switch in series with the Vcc line in order to protect the image sensor during testing. All other wires ran directly from the STK500 board to the solderboard on the handheld scanner.
An expanded diagram of the handheld scanner construction can be found in the Appendix.
Image Sensor
We sampled the TSL1402R linear image sensor from Texas Advanced Optoelectric Solutions. The image sensor we choose is a 256×1 pixel linear array made up of a line of 256 photodiodes. It has a 400 DPI resolution, with each pixel measuring 63.5 micrometers by 55.5 micrometers with an 8 micrometer spacing between pixels. It requires a 5V power supply, a ground supply, and a clock at any speed between 5KHz and 8MHz. The photodiode data is integrated (by an opamp-capacitor integrator), and output as an analog value between 0 (black) and 255 (saturated white). The pixels are output sequentially on each clock cycle after a start pulse (SI pulse). Thus, the output of the array is a series of analog values which represent each pixel value.
In addition to starting the output of the pixel data, the SI pulse serves another function. SI stands for “start integration”. The entire time between the SI pulse on one cycle and the SI pulse on the next cycle, the photodiode data is being integrated. The data that comes out during any pixel line is the data that was integrated during the output of the last line. The longer the integration time is, the more easily the sensor is saturated by light, the shorter it is, the less sensitive it is. Since the SI pulse cannot be received until after the entire line of pixels is output, the minimum integration time is the length of time it takes to output a line of pixels. This is controlled by the clock speed, so ultimately the clock speed controls the integration time, and thus the sensitivity of the sensor.
Parts List:
| Quantity | Item | Unit Price | Total Price | Notes |
| 2 | 2 Pin Jumper | $1.00 | $2.00 | Lab Rental |
| 1 | 10 Pin Jumper |
–
|
–
|
Lab Materials |
| 1 | 6 Pin Jumper |
–
|
–
|
Lab Materials |
| 3 | 1 Pin Jumper |
–
|
–
|
Lab Materials |
| 1 | 14 Pin PDIP Socket | $0.50 | $0.50 | Lab Rental |
| 1 | White Board | $6.00 | $6.00 | Lab Rental |
| 1 | 6″ DIP Solder Board | $2.50 | $2.50 | Lab Materials |
| 1 | 1/8″ Clear Plexiglass sheet |
–
|
–
|
Donated by Bruce Land |
| 1 | 5/8″ Brass Tubing | $3.69 | $3.69 | Cornell Store |
| 1 | 3/8″ Wood Spacer | $1.19 | $1.19 | Cornell Store |
| 1 | Plastic Cap |
–
|
–
|
Scrap Material |
| 2 | PDIP 8 Resistor Packs |
–
|
–
|
Lab Materials |
| 1 | LM358 Op-amp |
–
|
–
|
Lab Materials |
| 2 | 0.1 microFarad capacitor |
–
|
–
|
Lab Materials |
| 2 | 1K Resistor |
–
|
–
|
Lab Materials |
| 1 | Headphone Jack |
–
|
–
|
Lab Materials |
| 1 | Mechanical Switch |
–
|
–
|
Lab Materials |
| 20 | Sheets of printer paper |
–
|
–
|
Lab Materials |
| 1 | TAOS TSL1402R Image Sensor |
–
|
–
|
Sampled from TAOS |
| 1 | Overhead Projector |
–
|
–
|
Phillips Hall (borrowed) |
| 1 | Set of Computer Speakers | $5.00 | $5.00 | Lab Rental |
| 1 | Desktop PC |
–
|
–
|
Lab Materials |
| 1 | STK500 | $15.00 | $15.00 | Lab Rental |
| 1 | Power Supply | $5.00 | $5.00 | Lab Rental |
| 1 | Atmel Mega32 | $8.00 | $8.00 | Lab Rental |
| Total Cost | $43.88 |
For more detail: Music Wand: Real-Time Optical Scanning of Sheet Music Using Atmega32